26 Iteration
26.1 Introduction
In this chapter, you’ll learn tools for iteration, repeatedly performing the same action on different objects.
在本章中,你将学习迭代的工具,即对不同的对象重复执行相同的操作。
Iteration in R generally tends to look rather different from other programming languages because so much of it is implicit and we get it for free.
R 中的迭代通常看起来与其他编程语言大不相同,因为其中很多是隐式的,我们可以免费获得。
For example, if you want to double a numeric vector x in R, you can just write 2 * x.
例如,如果你想在 R 中将一个数值向量 x 的值加倍,你只需写 2 * x。
In most other languages, you’d need to explicitly double each element of x using some sort of for loop.
在大多数其他语言中,你需要使用某种 for 循环来显式地将 x 的每个元素加倍。
This book has already given you a small but powerful number of tools that perform the same action for multiple “things”:
本书已经为你提供了一些小而强大的工具,可以对多个“事物”执行相同的操作:
facet_wrap()andfacet_grid()draws a plot for each subset.facet_wrap()和facet_grid()为每个子集绘制一张图。group_by()plussummarize()computes summary statistics for each subset.group_by()加上summarize()为每个子集计算汇总统计量。unnest_wider()andunnest_longer()create new rows and columns for each element of a list-column.unnest_wider()和unnest_longer()为列表列的每个元素创建新的行和列。
Now it’s time to learn some more general tools, often called functional programming tools because they are built around functions that take other functions as inputs.
现在是时候学习一些更通用的工具了,这些工具通常被称为函数式编程 (functional programming) 工具,因为它们是围绕着接受其他函数作为输入的函数构建的。
Learning functional programming can easily veer into the abstract, but in this chapter we’ll keep things concrete by focusing on three common tasks: modifying multiple columns, reading multiple files, and saving multiple objects.
学习函数式编程很容易变得抽象,但在本章中,我们将通过关注三个常见任务来保持具体性:修改多个列、读取多个文件和保存多个对象。
26.1.1 Prerequisites
In this chapter, we’ll focus on tools provided by dplyr and purrr, both core members of the tidyverse.
在本章中,我们将重点介绍由 dplyr 和 purrr 提供的工具,它们都是 tidyverse 的核心成员。
You’ve seen dplyr before, but purrr is new.
你之前见过 dplyr,但 purrr 是新的。
We’re just going to use a couple of purrr functions in this chapter, but it’s a great package to explore as you improve your programming skills.
在本章中,我们只会使用几个 purrr 函数,但随着你编程技能的提高,它是一个非常值得探索的包。
26.2 Modifying multiple columns
Imagine you have this simple tibble and you want to count the number of observations and compute the median of every column.
假设你有这个简单的 tibble,并且你想要计算观测值的数量并计算每一列的中位数。
You could do it with copy-and-paste:
你可以通过复制粘贴来完成:
That breaks our rule of thumb to never copy and paste more than twice, and you can imagine that this will get very tedious if you have tens or even hundreds of columns.
这违反了我们“绝不复制粘贴超过两次”的经验法则,而且你可以想象,如果你有几十甚至几百列,这将变得非常繁琐。
Instead, you can use across():
相反,你可以使用 across():
across() has three particularly important arguments, which we’ll discuss in detail in the following sections.across() 有三个特别重要的参数,我们将在接下来的部分详细讨论。
You’ll use the first two every time you use across(): the first argument, .cols, specifies which columns you want to iterate over, and the second argument, .fns, specifies what to do with each column.
每次使用 across() 时,你都会用到前两个参数:第一个参数 .cols 指定了你想要迭代的列,第二个参数 .fns 指定了对每一列做什么。
You can use the .names argument when you need additional control over the names of output columns, which is particularly important when you use across() with mutate().
当你需要对输出列的名称进行额外控制时,可以使用 .names 参数,这在使用 across() 和 mutate() 时尤其重要。
We’ll also discuss two important variations, if_any() and if_all(), which work with filter().
我们还将讨论两个重要的变体,if_any() 和 if_all(),它们与 filter() 一起使用。
26.2.1 Selecting columns with .cols
The first argument to across(), .cols, selects the columns to transform.across() 的第一个参数 .cols 用于选择要转换的列。
This uses the same specifications as select(), Section 3.3.2, so you can use functions like starts_with() and ends_with() to select columns based on their name.
它使用与 select() 相同的规范,见 Section 3.3.2,所以你可以使用像 starts_with() 和 ends_with() 这样的函数来根据列名选择列。
There are two additional selection techniques that are particularly useful for across(): everything() and where().
还有两种额外的选择技术对 across() 特别有用:everything() 和 where()。
everything() is straightforward: it selects every (non-grouping) column:everything() 很直接:它选择每一个(非分组)列:
df <- tibble(
  grp = sample(2, 10, replace = TRUE),
  a = rnorm(10),
  b = rnorm(10),
  c = rnorm(10),
  d = rnorm(10)
)

df |>
  group_by(grp) |>
  summarize(across(everything(), median))
#> # A tibble: 2 × 5
#>     grp       a       b     c     d
#>   <int>   <dbl>   <dbl> <dbl> <dbl>
#> 1     1 -0.0935 -0.0163 0.363 0.364
#> 2     2  0.312  -0.0576 0.208 0.565
Note grouping columns (grp here) are not included in across(), because they’re automatically preserved by summarize().
注意分组列(此处的 grp)不包含在 across() 中,因为它们被 summarize() 自动保留了。
where() allows you to select columns based on their type:where() 允许你根据列的类型来选择列:
where(is.numeric)selects all numeric columns.where(is.numeric)选择所有数值型列。where(is.character)selects all string columns.where(is.character)选择所有字符型列。where(is.Date)selects all date columns.where(is.Date)选择所有日期型列。where(is.POSIXct)selects all date-time columns.where(is.POSIXct)选择所有日期时间型列。where(is.logical)selects all logical columns.where(is.logical)选择所有逻辑型列。
Just like other selectors, you can combine these with Boolean algebra.
就像其他选择器一样,你可以将它们与布尔代数结合使用。
For example, !where(is.numeric) selects all non-numeric columns, and starts_with("a") & where(is.logical) selects all logical columns whose name starts with “a”.
例如,!where(is.numeric) 选择所有非数值型列,而 starts_with("a") & where(is.logical) 选择所有名称以 “a” 开头的逻辑型列。
26.2.2 Calling a single function
The second argument to across() defines how each column will be transformed.across() 的第二个参数定义了每一列将如何被转换。
In simple cases, as above, this will be a single existing function.
在简单的情况下,如上所述,这将是一个单一的现有函数。
This is a pretty special feature of R: we’re passing one function (median, mean, str_flatten, …) to another function (across).
这是 R 的一个相当特殊的特性:我们将一个函数(median、mean、str_flatten 等)传递给另一个函数 (across)。
This is one of the features that makes R a functional programming language.
这是使 R 成为一门函数式编程语言的特性之一。
It’s important to note that we’re passing this function to across(), so across() can call it; we’re not calling it ourselves.
重要的是要注意,我们是将这个函数传递给 across(),以便 across() 可以调用它;我们不是自己调用它。
That means the function name should never be followed by ().
这意味着函数名后面不应该跟 ()。
If you forget, you’ll get an error:
如果你忘了,你会得到一个错误:
df |>
  group_by(grp) |>
  summarize(across(everything(), median()))
#> Error in `summarize()`:
#> ℹ In argument: `across(everything(), median())`.
#> Caused by error in `median.default()`:
#> ! argument "x" is missing, with no default
This error arises because you’re calling the function with no input, e.g.:
这个错误的出现是因为你在没有输入的情况下调用了函数,例如:
median()
#> Error in median.default(): argument "x" is missing, with no default
26.2.3 Calling multiple functions
In more complex cases, you might want to supply additional arguments or perform multiple transformations.
在更复杂的情况下,你可能想要提供额外的参数或执行多个转换。
Let’s motivate this problem with a simple example: what happens if we have some missing values in our data?
让我们用一个简单的例子来引出这个问题:如果我们的数据中有一些缺失值会发生什么?
median() propagates those missing values, giving us a suboptimal output:median() 会传播这些缺失值,导致一个次优的输出:
rnorm_na <- function(n, n_na, mean = 0, sd = 1) {
  sample(c(rnorm(n - n_na, mean = mean, sd = sd), rep(NA, n_na)))
}

df_miss <- tibble(
  a = rnorm_na(5, 1),
  b = rnorm_na(5, 1),
  c = rnorm_na(5, 2),
  d = rnorm(5)
)
df_miss |>
  summarize(
    across(a:d, median),
    n = n()
  )
#> # A tibble: 1 × 5
#>       a     b     c     d     n
#>   <dbl> <dbl> <dbl> <dbl> <int>
#> 1    NA    NA    NA  1.15     5
It would be nice if we could pass along na.rm = TRUE to median() to remove these missing values.
如果我们能将 na.rm = TRUE 传递给 median() 来移除这些缺失值,那就太好了。
To do so, instead of calling median() directly, we need to create a new function that calls median() with the desired arguments:
要做到这一点,我们不能直接调用 median(),而是需要创建一个新函数,用所需的参数来调用 median():
This is a little verbose, so R comes with a handy shortcut: for this sort of throw away, or anonymous[^6], function you can replace function with \[^7]:
这有点冗长,所以 R 提供了一个方便的快捷方式:对于这种一次性使用的,或者说匿名 (anonymous)6 的函数,你可以用 \ 替换 function7:
In either case, across() effectively expands to the following code:
在任何一种情况下,across() 实际上都等同于展开成以下代码:
When we remove the missing values from the median(), it would be nice to know just how many values were removed.
当我们从 median() 中移除缺失值时,如果能知道移除了多少个值就更好了。
We can find that out by supplying two functions to across(): one to compute the median and the other to count the missing values.
我们可以通过向 across() 提供两个函数来做到这一点:一个用于计算中位数,另一个用于计算缺失值的数量。
You supply multiple functions by using a named list to .fns:
你可以通过使用一个命名的列表作为 .fns 来提供多个函数:
df_miss |>
  summarize(
    across(a:d, list(
      median = \(x) median(x, na.rm = TRUE),
      n_miss = \(x) sum(is.na(x))
    )),
    n = n()
  )
#> # A tibble: 1 × 9
#>   a_median a_n_miss b_median b_n_miss c_median c_n_miss d_median d_n_miss
#>      <dbl>    <int>    <dbl>    <int>    <dbl>    <int>    <dbl>    <int>
#> 1    0.139        1    -1.11        1   -0.387        2     1.15        0
#> # ℹ 1 more variable: n <int>
If you look carefully, you might intuit that the columns are named using a glue specification (Section 14.3.2) like {.col}_{.fn} where .col is the name of the original column and .fn is the name of the function.
如果你仔细观察,你可能会直觉地认为列是根据一个类似 {.col}_{.fn} 的 glue 规范 (Section 14.3.2) 来命名的,其中 .col 是原始列的名称,.fn 是函数的名称。
That’s not a coincidence!
那不是巧合!
As you’ll learn in the next section, you can use the .names argument to supply your own glue spec.
正如你将在下一节中学到的,你可以使用 .names 参数来提供你自己的 glue 规范。
26.2.4 Column names
The result of across() is named according to the specification provided in the .names argument.across() 的结果是根据 .names 参数中提供的规范来命名的。
We could specify our own if we wanted the name of the function to come first[^3]:
如果我们希望函数名排在前面,我们可以自己指定[^3]:
df_miss |>
  summarize(
    across(
      a:d,
      list(
        median = \(x) median(x, na.rm = TRUE),
        n_miss = \(x) sum(is.na(x))
      ),
      .names = "{.fn}_{.col}"
    ),
    n = n(),
  )
#> # A tibble: 1 × 9
#>   median_a n_miss_a median_b n_miss_b median_c n_miss_c median_d n_miss_d
#>      <dbl>    <int>    <dbl>    <int>    <dbl>    <int>    <dbl>    <int>
#> 1    0.139        1    -1.11        1   -0.387        2     1.15        0
#> # ℹ 1 more variable: n <int>
The .names argument is particularly important when you use across() with mutate().
当您将 across() 与 mutate() 结合使用时,.names 参数尤其重要。
By default, the output of across() is given the same names as the inputs.
默认情况下,across() 的输出被赋予与输入相同的名称。
This means that across() inside of mutate() will replace existing columns.
这意味着 mutate() 中的 across() 将替换现有的列。
For example, here we use coalesce() to replace NAs with 0:
例如,在这里我们使用 coalesce() 将 NA 替换为 0:
If you’d like to instead create new columns, you can use the .names argument to give the output new names:
如果你想创建新列,可以使用 .names 参数为输出赋予新名称:
df_miss |>
  mutate(
    across(a:d, \(x) coalesce(x, 0), .names = "{.col}_na_zero")
  )
#> # A tibble: 5 × 8
#>        a      b      c     d a_na_zero b_na_zero c_na_zero d_na_zero
#>    <dbl>  <dbl>  <dbl> <dbl>     <dbl>     <dbl>     <dbl>     <dbl>
#> 1  0.434 -1.25  NA     1.60      0.434    -1.25      0         1.60
#> 2 NA     -1.43  -0.297 0.776     0        -1.43     -0.297     0.776
#> 3 -0.156 -0.980 NA     1.15     -0.156    -0.980     0         1.15
#> 4 -2.61  -0.683 -0.785 2.13     -2.61     -0.683    -0.785     2.13
#> 5  1.11  NA     -0.387 0.704     1.11      0        -0.387     0.704
26.2.5 Filtering
across() is a great match for summarize() and mutate() but it’s more awkward to use with filter(), because you usually combine multiple conditions with either | or &.across() 与 summarize() 和 mutate() 配合得很好,但与 filter() 一起使用时就比较尴尬,因为你通常需要用 | 或 & 来组合多个条件。
It’s clear that across() can help to create multiple logical columns, but then what?
很明显 across() 可以帮助创建多个逻辑列,但之后呢?
So dplyr provides two variants of across() called if_any() and if_all():
因此 dplyr 提供了 across() 的两个变体,名为 if_any() 和 if_all():
# same as df_miss |> filter(is.na(a) | is.na(b) | is.na(c) | is.na(d))
df_miss |> filter(if_any(a:d, is.na))
#> # A tibble: 4 × 4
#>        a      b      c     d
#>    <dbl>  <dbl>  <dbl> <dbl>
#> 1  0.434 -1.25  NA     1.60
#> 2 NA     -1.43  -0.297 0.776
#> 3 -0.156 -0.980 NA     1.15
#> 4  1.11  NA     -0.387 0.704

# same as df_miss |> filter(is.na(a) & is.na(b) & is.na(c) & is.na(d))
df_miss |> filter(if_all(a:d, is.na))
#> # A tibble: 0 × 4
#> # ℹ 4 variables: a <dbl>, b <dbl>, c <dbl>, d <dbl>
26.2.6 across() in functions
across() is particularly useful to program with because it allows you to operate on multiple columns.across() 在编程中特别有用,因为它允许你对多个列进行操作。
For example, Jacob Scott uses this little helper which wraps a bunch of lubridate functions to expand all date columns into year, month, and day columns:
例如,Jacob Scott 使用这个小辅助函数,它封装了一系列 lubridate 函数,将所有日期列扩展为年、月、日列:
expand_dates <- function(df) {
  df |>
    mutate(
      across(where(is.Date), list(year = year, month = month, day = mday))
    )
}

df_date <- tibble(
  name = c("Amy", "Bob"),
  date = ymd(c("2009-08-03", "2010-01-16"))
)

df_date |>
  expand_dates()
#> # A tibble: 2 × 5
#>   name  date       date_year date_month date_day
#>   <chr> <date>         <dbl>      <dbl>    <int>
#> 1 Amy   2009-08-03      2009          8        3
#> 2 Bob   2010-01-16      2010          1       16
across() also makes it easy to supply multiple columns in a single argument because the first argument uses tidy-select; you just need to remember to embrace that argument, as we discussed in Section 25.3.2.across() 也使得在单个参数中提供多个列变得容易,因为第一个参数使用了整洁选择(tidy-select);你只需要记住拥抱(embrace)那个参数,正如我们在 Section 25.3.2 中讨论的那样。
For example, this function will compute the means of numeric columns by default.
例如,这个函数默认会计算数值列的均值。
But by supplying the second argument you can choose to summarize just selected columns:
但通过提供第二个参数,你可以选择只对选定的列进行汇总:
summarize_means <- function(df, summary_vars = where(is.numeric)) {
  df |>
    summarize(
      across({{ summary_vars }}, \(x) mean(x, na.rm = TRUE)),
      n = n(),
      .groups = "drop"
    )
}
diamonds |>
  group_by(cut) |>
  summarize_means()
#> # A tibble: 5 × 9
#>   cut       carat depth table price     x     y     z     n
#>   <ord>     <dbl> <dbl> <dbl> <dbl> <dbl> <dbl> <dbl> <int>
#> 1 Fair      1.05   64.0  59.1 4359.  6.25  6.18  3.98  1610
#> 2 Good      0.849  62.4  58.7 3929.  5.84  5.85  3.64  4906
#> 3 Very Good 0.806  61.8  58.0 3982.  5.74  5.77  3.56 12082
#> 4 Premium   0.892  61.3  58.7 4584.  5.97  5.94  3.65 13791
#> 5 Ideal     0.703  61.7  56.0 3458.  5.51  5.52  3.40 21551

diamonds |>
  group_by(cut) |>
  summarize_means(c(carat, x:z))
#> # A tibble: 5 × 6
#>   cut       carat     x     y     z     n
#>   <ord>     <dbl> <dbl> <dbl> <dbl> <int>
#> 1 Fair      1.05   6.25  6.18  3.98  1610
#> 2 Good      0.849  5.84  5.85  3.64  4906
#> 3 Very Good 0.806  5.74  5.77  3.56 12082
#> 4 Premium   0.892  5.97  5.94  3.65 13791
#> 5 Ideal     0.703  5.51  5.52  3.40 21551
26.2.7 Compare with pivot_longer()
Before we go on, it’s worth pointing out an interesting connection between across() and pivot_longer() (Section 5.3). In many cases, you perform the same calculations by first pivoting the data and then performing the operations by group rather than by column. For example, take this multi-function summary:
在我们继续之前,有必要指出 across() 和 pivot_longer() (Section 5.3) 之间一个有趣的联系。在许多情况下,你可以通过先转换数据,然后按组而不是按列执行操作来完成相同的计算。例如,看这个多函数摘要:
We could compute the same values by pivoting longer and then summarizing:
我们可以通过先加长数据再进行汇总来计算相同的值:
long <- df |>
  pivot_longer(a:d) |>
  group_by(name) |>
  summarize(
    median = median(value),
    mean = mean(value)
  )
long
#> # A tibble: 4 × 3
#>   name   median   mean
#>   <chr>   <dbl>  <dbl>
#> 1 a      0.0380 0.205
#> 2 b     -0.0163 0.0910
#> 3 c      0.260  0.0716
#> 4 d      0.540  0.508
And if you wanted the same structure as across() you could pivot again:
如果你想要和 across() 一样的结构,你可以再次进行转换:
long |>
  pivot_wider(
    names_from = name,
    values_from = c(median, mean),
    names_vary = "slowest",
    names_glue = "{name}_{.value}"
  )
#> # A tibble: 1 × 8
#>   a_median a_mean b_median b_mean c_median c_mean d_median d_mean
#>      <dbl>  <dbl>    <dbl>  <dbl>    <dbl>  <dbl>    <dbl>  <dbl>
#> 1   0.0380  0.205  -0.0163 0.0910    0.260 0.0716    0.540  0.508
This is a useful technique to know about because sometimes you’ll hit a problem that’s not currently possible to solve with across(): when you have groups of columns that you want to compute with simultaneously. For example, imagine that our data frame contains both values and weights and we want to compute a weighted mean:
这是一个很有用的技巧,因为有时你会遇到一个目前无法用 across() 解决的问题:当你有多组列需要同时进行计算时。例如,假设我们的数据框同时包含值和权重,我们想要计算加权平均值:
There’s currently no way to do this with across()[^4], but it’s relatively straightforward with pivot_longer():
目前没有办法用 across() 做到这一点4,但用 pivot_longer() 就相对直接了:
df_long <- df_paired |>
  pivot_longer(
    everything(),
    names_to = c("group", ".value"),
    names_sep = "_"
  )
df_long
#> # A tibble: 40 × 3
#>   group    val   wts
#>   <chr>  <dbl> <dbl>
#> 1 a      0.715 0.518
#> 2 b     -0.709 0.691
#> 3 c      0.718 0.216
#> 4 d     -0.217 0.733
#> 5 a     -1.09  0.979
#> 6 b     -0.209 0.675
#> # ℹ 34 more rows

df_long |>
  group_by(group) |>
  summarize(mean = weighted.mean(val, wts))
#> # A tibble: 4 × 2
#>   group    mean
#>   <chr>   <dbl>
#> 1 a      0.126
#> 2 b     -0.0704
#> 3 c     -0.360
#> 4 d     -0.248
If needed, you could pivot_wider() this back to the original form.
如果需要,你可以用 pivot_wider() 将其转换回原始形式。
26.2.8 Exercises
-
Practice your
across()skills by:Computing the number of unique values in each column of
palmerpenguins::penguins.Computing the mean of every column in
mtcars.Grouping
diamondsbycut,clarity, andcolorthen counting the number of observations and computing the mean of each numeric column.
What happens if you use a list of functions in
across(), but don’t name them? How is the output named?Adjust
expand_dates()to automatically remove the date columns after they’ve been expanded. Do you need to embrace any arguments?-
Explain what each step of the pipeline in this function does. What special feature of
where()are we taking advantage of?
26.3 Reading multiple files
In the previous section, you learned how to use dplyr::across() to repeat a transformation on multiple columns. In this section, you’ll learn how to use purrr::map() to do something to every file in a directory. Let’s start with a little motivation: imagine you have a directory full of excel spreadsheets[^2] you want to read. You could do it with copy and paste:
在上一节中,你学习了如何使用 dplyr::across() 对多列重复进行转换。在本节中,你将学习如何使用 purrr::map() 对目录中的每个文件执行操作。让我们从一个小的动机开始:想象一下,你有一个装满了你想要读取的 Excel 电子表格的目录[^2]。你可以通过复制粘贴来完成:
data2019 <- readxl::read_excel("data/y2019.xlsx")
data2020 <- readxl::read_excel("data/y2020.xlsx")
data2021 <- readxl::read_excel("data/y2021.xlsx")
data2022 <- readxl::read_excel("data/y2022.xlsx")
And then use dplyr::bind_rows() to combine them all together:
然后使用 dplyr::bind_rows() 将它们全部合并在一起:
data <- bind_rows(data2019, data2020, data2021, data2022)You can imagine that this would get tedious quickly, especially if you had hundreds of files, not just four. The following sections show you how to automate this sort of task. There are three basic steps: use list.files() to list all the files in a directory, then use purrr::map() to read each of them into a list, then use purrr::list_rbind() to combine them into a single data frame. We’ll then discuss how you can handle situations of increasing heterogeneity, where you can’t do exactly the same thing to every file.
你可以想象,这很快就会变得乏味,特别是如果你有数百个文件,而不仅仅是四个。接下来的部分将向你展示如何自动化这类任务。有三个基本步骤:使用 list.files() 列出目录中的所有文件,然后使用 purrr::map() 将每个文件读入一个列表,再使用 purrr::list_rbind() 将它们合并成一个单一的数据框。然后,我们将讨论如何处理异质性增加的情况,即你不能对每个文件都做完全相同的事情。
26.3.1 Listing files in a directory
As the name suggests, list.files() lists the files in a directory. You’ll almost always use three arguments:
顾名思义,list.files() 会列出目录中的文件。你几乎总是会使用三个参数:
The first argument,
path, is the directory to look in.
第一个参数path是要查找的目录。patternis a regular expression used to filter the file names. The most common pattern is something like[.]xlsx$or[.]csv$to find all files with a specified extension.pattern是一个用于筛选文件名的正则表达式。最常见的模式是像[.]xlsx$或[.]csv$这样的,用来查找所有具有指定扩展名的文件。full.namesdetermines whether or not the directory name should be included in the output.
You almost always want this to beTRUE.full.names决定了目录名是否应包含在输出中。你几乎总是希望这个值为TRUE。
To make our motivating example concrete, this book contains a folder with 12 excel spreadsheets containing data from the gapminder package. Each file contains one year’s worth of data for 142 countries. We can list them all with the appropriate call to list.files():
为了让我们的激励示例更具体,本书包含一个文件夹,里面有 12 个 Excel 电子表格,其中包含来自 gapminder 包的数据。每个文件包含 142 个国家一年的数据。我们可以使用对 list.files() 的适当调用来列出所有这些文件:
paths <- list.files("data/gapminder", pattern = "[.]xlsx$", full.names = TRUE)
paths
#>  [1] "data/gapminder/1952.xlsx" "data/gapminder/1957.xlsx"
#>  [3] "data/gapminder/1962.xlsx" "data/gapminder/1967.xlsx"
#>  [5] "data/gapminder/1972.xlsx" "data/gapminder/1977.xlsx"
#>  [7] "data/gapminder/1982.xlsx" "data/gapminder/1987.xlsx"
#>  [9] "data/gapminder/1992.xlsx" "data/gapminder/1997.xlsx"
#> [11] "data/gapminder/2002.xlsx" "data/gapminder/2007.xlsx"
26.3.2 Lists
Now that we have these 12 paths, we could call read_excel() 12 times to get 12 data frames:
现在我们有了这 12 个路径,我们可以调用 read_excel() 12 次来获取 12 个数据框:
gapminder_1952 <- readxl::read_excel("data/gapminder/1952.xlsx")
gapminder_1957 <- readxl::read_excel("data/gapminder/1957.xlsx")
gapminder_1962 <- readxl::read_excel("data/gapminder/1962.xlsx")
  ...,
gapminder_2007 <- readxl::read_excel("data/gapminder/2007.xlsx")
But putting each sheet into its own variable is going to make it hard to work with them a few steps down the road. Instead, they’ll be easier to work with if we put them into a single object. A list is the perfect tool for this job:
但是,将每个工作表放入其自己的变量中,会在后续步骤中难以处理。相反,如果我们将它们放入一个单一的对象中,处理起来会更容易。列表 (list) 是完成这项工作的完美工具:
files <- list(
  readxl::read_excel("data/gapminder/1952.xlsx"),
  readxl::read_excel("data/gapminder/1957.xlsx"),
  readxl::read_excel("data/gapminder/1962.xlsx"),
  ...,
  readxl::read_excel("data/gapminder/2007.xlsx")
)
Now that you have these data frames in a list, how do you get one out? You can use files[[i]] to extract the i<sup>th</sup> element:
现在你已经将这些数据框放在一个列表中了,你该如何取出一个呢?你可以使用 files[[i]] 来提取第 i<sup>th</sup> 个元素:
files[[3]]
#> # A tibble: 142 × 5
#>   country     continent lifeExp      pop gdpPercap
#>   <chr>       <chr>       <dbl>    <dbl>     <dbl>
#> 1 Afghanistan Asia         32.0 10267083      853.
#> 2 Albania     Europe       64.8  1728137     2313.
#> 3 Algeria     Africa       48.3 11000948     2551.
#> 4 Angola      Africa       34    4826015     4269.
#> 5 Argentina   Americas     65.1 21283783     7133.
#> 6 Australia   Oceania      70.9 10794968    12217.
#> # ℹ 136 more rows
We’ll come back to [[ in more detail in Section 27.3.
我们将在 Section 27.3 中更详细地回过头来讨论 [[。
26.3.3 purrr::map() and list_rbind()
The code to collect those data frames in a list “by hand” is basically just as tedious to type as code that reads the files one-by-one. Happily, we can use purrr::map() to make even better use of our paths vector. map() is similar toacross(), but instead of doing something to each column in a data frame, it does something to each element of a vector.map(x, f) is shorthand for:
“手动”收集那些数据框到列表中的代码,基本上和逐个读取文件的代码一样乏味。幸运的是,我们可以使用 purrr::map() 来更好地利用我们的 paths 向量。map() 类似于 across(),但它不是对数据框的每一列执行操作,而是对向量的每个元素执行操作。map(x, f) 是以下代码的简写:
list(
  f(x[[1]]),
  f(x[[2]]),
  ...,
  f(x[[n]])
)
So we can use map() to get a list of 12 data frames:
所以我们可以使用 map() 来得到一个包含 12 个数据框的列表:
files <- map(paths, readxl::read_excel)
length(files)
#> [1] 12

files[[1]]
#> # A tibble: 142 × 5
#>   country     continent lifeExp      pop gdpPercap
#>   <chr>       <chr>       <dbl>    <dbl>     <dbl>
#> 1 Afghanistan Asia         28.8  8425333      779.
#> 2 Albania     Europe       55.2  1282697     1601.
#> 3 Algeria     Africa       43.1  9279525     2449.
#> 4 Angola      Africa       30.0  4232095     3521.
#> 5 Argentina   Americas     62.5 17876956     5911.
#> 6 Australia   Oceania      69.1  8691212    10040.
#> # ℹ 136 more rows
(This is another data structure that doesn’t display particularly compactly with str() so you might want to load it into RStudio and inspect it with View()).
(这是另一个用 str() 显示不够紧凑的数据结构,所以你可能想将它加载到 RStudio 中并用 View() 来检查它)。
Now we can use purrr::list_rbind() to combine that list of data frames into a single data frame:
现在我们可以使用 purrr::list_rbind() 将那个数据框列表合并成一个单一的数据框:
list_rbind(files)
#> # A tibble: 1,704 × 5
#>   country     continent lifeExp      pop gdpPercap
#>   <chr>       <chr>       <dbl>    <dbl>     <dbl>
#> 1 Afghanistan Asia         28.8  8425333      779.
#> 2 Albania     Europe       55.2  1282697     1601.
#> 3 Algeria     Africa       43.1  9279525     2449.
#> 4 Angola      Africa       30.0  4232095     3521.
#> 5 Argentina   Americas     62.5 17876956     5911.
#> 6 Australia   Oceania      69.1  8691212    10040.
#> # ℹ 1,698 more rows
Or we could do both steps at once in a pipeline:
或者我们可以在一个管道中一次性完成这两个步骤:
paths |>
  map(readxl::read_excel) |>
  list_rbind()
What if we want to pass in extra arguments to read_excel()? We use the same technique that we used with across(). For example, it’s often useful to peek at the first few rows of the data with n_max = 1:
如果我们想给 read_excel() 传递额外的参数怎么办?我们使用与 across() 相同的技术。例如,用 n_max = 1 来查看数据的前几行通常很有用:
paths |>
  map(\(path) readxl::read_excel(path, n_max = 1)) |>
  list_rbind()
#> # A tibble: 12 × 5
#>   country     continent lifeExp      pop gdpPercap
#>   <chr>       <chr>       <dbl>    <dbl>     <dbl>
#> 1 Afghanistan Asia         28.8  8425333      779.
#> 2 Afghanistan Asia         30.3  9240934      821.
#> 3 Afghanistan Asia         32.0 10267083      853.
#> 4 Afghanistan Asia         34.0 11537966      836.
#> 5 Afghanistan Asia         36.1 13079460      740.
#> 6 Afghanistan Asia         38.4 14880372      786.
#> # ℹ 6 more rows
This makes it clear that something is missing: there’s no year column because that value is recorded in the path, not in the individual files. We’ll tackle that problem next.
这清楚地表明有些东西丢失了:没有 year 列,因为该值记录在路径中,而不是在单个文件中。我们接下来将解决这个问题。
26.3.4 Data in the path
Sometimes the name of the file is data itself. In this example, the file name contains the year, which is not otherwise recorded in the individual files. To get that column into the final data frame, we need to do two things:
有时文件名本身就是数据。在这个例子中,文件名包含了年份,而这个信息在单个文件中并没有记录。为了将这一列加入到最终的数据框中,我们需要做两件事:
First, we name the vector of paths. The easiest way to do this is with the set_names() function, which can take a function. Here we use basename() to extract just the file name from the full path:
首先,我们为路径向量命名。最简单的方法是使用 set_names() 函数,它可以接受一个函数作为参数。这里我们使用 basename() 从完整路径中提取文件名:
paths |> set_names(basename)
#>                  1952.xlsx                  1957.xlsx
#> "data/gapminder/1952.xlsx" "data/gapminder/1957.xlsx"
#>                  1962.xlsx                  1967.xlsx
#> "data/gapminder/1962.xlsx" "data/gapminder/1967.xlsx"
#>                  1972.xlsx                  1977.xlsx
#> "data/gapminder/1972.xlsx" "data/gapminder/1977.xlsx"
#>                  1982.xlsx                  1987.xlsx
#> "data/gapminder/1982.xlsx" "data/gapminder/1987.xlsx"
#>                  1992.xlsx                  1997.xlsx
#> "data/gapminder/1992.xlsx" "data/gapminder/1997.xlsx"
#>                  2002.xlsx                  2007.xlsx
#> "data/gapminder/2002.xlsx" "data/gapminder/2007.xlsx"
Those names are automatically carried along by all the map functions, so the list of data frames will have those same names:
这些名称会自动被所有 map 函数沿用,所以数据框列表也会有相同的名称:
files <- paths |>
  set_names(basename) |>
  map(readxl::read_excel)
That makes this call to map() shorthand for:
这使得对 map() 的调用成为以下代码的简写:
files <- list(
  "1952.xlsx" = readxl::read_excel("data/gapminder/1952.xlsx"),
  "1957.xlsx" = readxl::read_excel("data/gapminder/1957.xlsx"),
  "1962.xlsx" = readxl::read_excel("data/gapminder/1962.xlsx"),
  ...,
  "2007.xlsx" = readxl::read_excel("data/gapminder/2007.xlsx")
)
You can also use [[ to extract elements by name:
你也可以使用 [[ 按名称提取元素:
files[["1962.xlsx"]]
#> # A tibble: 142 × 5
#>   country     continent lifeExp      pop gdpPercap
#>   <chr>       <chr>       <dbl>    <dbl>     <dbl>
#> 1 Afghanistan Asia         32.0 10267083      853.
#> 2 Albania     Europe       64.8  1728137     2313.
#> 3 Algeria     Africa       48.3 11000948     2551.
#> 4 Angola      Africa       34    4826015     4269.
#> 5 Argentina   Americas     65.1 21283783     7133.
#> 6 Australia   Oceania      70.9 10794968    12217.
#> # ℹ 136 more rows
Then we use the names_to argument to list_rbind() to tell it to save the names into a new column called year then use readr::parse_number() to extract the number from the string.
然后我们使用 list_rbind() 的 names_to 参数,告诉它将名称保存到一个名为 year 的新列中,然后使用 readr::parse_number() 从字符串中提取数字。
paths |>
  set_names(basename) |>
  map(readxl::read_excel) |>
  list_rbind(names_to = "year") |>
  mutate(year = parse_number(year))
#> # A tibble: 1,704 × 6
#>    year country     continent lifeExp      pop gdpPercap
#>   <dbl> <chr>       <chr>       <dbl>    <dbl>     <dbl>
#> 1  1952 Afghanistan Asia         28.8  8425333      779.
#> 2  1952 Albania     Europe       55.2  1282697     1601.
#> 3  1952 Algeria     Africa       43.1  9279525     2449.
#> 4  1952 Angola      Africa       30.0  4232095     3521.
#> 5  1952 Argentina   Americas     62.5 17876956     5911.
#> 6  1952 Australia   Oceania      69.1  8691212    10040.
#> # ℹ 1,698 more rows
In more complicated cases, there might be other variables stored in the directory name, or maybe the file name contains multiple bits of data. In that case, use set_names() (without any arguments) to record the full path, and then use tidyr::separate_wider_delim() and friends to turn them into useful columns.
在更复杂的情况下,目录名中可能存储了其他变量,或者文件名可能包含多个数据片段。在这种情况下,使用 set_names()(不带任何参数)来记录完整路径,然后使用 tidyr::separate_wider_delim() 及其相关函数将它们转换成有用的列。
paths |>
  set_names() |>
  map(readxl::read_excel) |>
  list_rbind(names_to = "year") |>
  separate_wider_delim(year, delim = "/", names = c(NA, "dir", "file")) |>
  separate_wider_delim(file, delim = ".", names = c("file", "ext"))
#> # A tibble: 1,704 × 8
#>   dir       file  ext   country     continent lifeExp      pop gdpPercap
#>   <chr>     <chr> <chr> <chr>       <chr>       <dbl>    <dbl>     <dbl>
#> 1 gapminder 1952  xlsx  Afghanistan Asia         28.8  8425333      779.
#> 2 gapminder 1952  xlsx  Albania     Europe       55.2  1282697     1601.
#> 3 gapminder 1952  xlsx  Algeria     Africa       43.1  9279525     2449.
#> 4 gapminder 1952  xlsx  Angola      Africa       30.0  4232095     3521.
#> 5 gapminder 1952  xlsx  Argentina   Americas     62.5 17876956     5911.
#> 6 gapminder 1952  xlsx  Australia   Oceania      69.1  8691212    10040.
#> # ℹ 1,698 more rows
26.3.5 Save your work
Now that you’ve done all this hard work to get to a nice tidy data frame, it’s a great time to save your work:
既然你已经费了这么多功夫得到了一个整洁的数据框,现在是保存你工作成果的好时机:
gapminder <- paths |>
  set_names(basename) |>
  map(readxl::read_excel) |>
  list_rbind(names_to = "year") |>
  mutate(year = parse_number(year))

write_csv(gapminder, "gapminder.csv")
Now when you come back to this problem in the future, you can read in a single csv file. For large and richer datasets, using parquet might be a better choice than .csv, as discussed in Section 22.4.
现在,当你将来再次处理这个问题时,你可以直接读取一个 CSV 文件。对于大型且更丰富的数据集,使用 Parquet 可能是比 .csv 更好的选择,正如在 Section 22.4 中讨论的那样。
If you’re working in a project, we suggest calling the file that does this sort of data prep work something like 0-cleanup.R. The 0 in the file name suggests that this should be run before anything else.
如果你在一个项目中工作,我们建议将执行此类数据准备工作的文件命名为 0-cleanup.R 之类的名称。文件名中的 0 暗示这个文件应该在其他任何文件之前运行。
If your input data files change over time, you might consider learning a tool like targets to set up your data cleaning code to automatically re-run whenever one of the input files is modified.
如果你的输入数据文件随时间变化,你可能需要考虑学习一个像 targets 这样的工具,来设置你的数据清理代码,以便在任何输入文件被修改时自动重新运行。
26.3.6 Many simple iterations
Here we’ve just loaded the data directly from disk, and were lucky enough to get a tidy dataset. In most cases, you’ll need to do some additional tidying, and you have two basic options: you can do one round of iteration with a complex function, or do multiple rounds of iteration with simple functions. In our experience most folks reach first for one complex iteration, but you’re often better by doing multiple simple iterations.
在这里,我们只是直接从磁盘加载了数据,并且幸运地得到了一个整洁的数据集。在大多数情况下,你需要进行一些额外的整理,你有两个基本选择:你可以用一个复杂的函数进行一轮迭代,或者用简单的函数进行多轮迭代。根据我们的经验,大多数人首先会选择进行一次复杂的迭代,但通常通过进行多次简单的迭代会更好。
For example, imagine that you want to read in a bunch of files, filter out missing values, pivot, and then combine. One way to approach the problem is to write a function that takes a file and does all those steps then call map() once:
例如,想象一下你想读入一堆文件,过滤掉缺失值,进行数据透视,然后合并。一种解决问题的方法是编写一个函数,该函数接受一个文件并执行所有这些步骤,然后调用 map() 一次:
process_file <- function(path) {
  df <- read_csv(path)

  df |>
    filter(!is.na(id)) |>
    mutate(id = tolower(id)) |>
    pivot_longer(jan:dec, names_to = "month")
}

paths |>
  map(process_file) |>
  list_rbind()
Alternatively, you could perform each step of process_file() to every file:
或者,你可以对每个文件执行 process_file() 的每一步:
paths |>
  map(read_csv) |>
  map(\(df) df |> filter(!is.na(id))) |>
  map(\(df) df |> mutate(id = tolower(id))) |>
  map(\(df) df |> pivot_longer(jan:dec, names_to = "month")) |>
  list_rbind()
We recommend this approach because it stops you getting fixated on getting the first file right before moving on to the rest. By considering all of the data when doing tidying and cleaning, you’re more likely to think holistically and end up with a higher quality result.
我们推荐这种方法,因为它能防止你在处理其他文件之前,过分执着于把第一个文件处理好。在进行数据整理和清洗时,通过考虑所有数据,你更有可能进行整体思考,并最终得到更高质量的结果。
In this particular example, there’s another optimization you could make, by binding all the data frames together earlier. Then you can rely on regular dplyr behavior:
在这个特定的例子中,你还可以进行另一个优化,即更早地将所有数据框绑定在一起。然后你就可以依赖常规的 dplyr 行为:
paths |>
  map(read_csv) |>
  list_rbind() |>
  filter(!is.na(id)) |>
  mutate(id = tolower(id)) |>
  pivot_longer(jan:dec, names_to = "month")
26.3.7 Heterogeneous data
Unfortunately, sometimes it’s not possible to go from map() straight to list_rbind() because the data frames are so heterogeneous that list_rbind() either fails or yields a data frame that’s not very useful. In that case, it’s still useful to start by loading all of the files:
不幸的是,有时无法直接从 map() 转到 list_rbind(),因为数据框的异构性太强,导致 list_rbind() 要么失败,要么产生一个不太有用的数据框。在这种情况下,从加载所有文件开始仍然是很有用的:
files <- paths |>
  map(readxl::read_excel)
Then a very useful strategy is to capture the structure of the data frames so that you can explore it using your data science skills. One way to do so is with this handy df_types function[^1] that returns a tibble with one row for each column:
然后,一个非常有用的策略是捕获数据框的结构,以便你可以运用数据科学技能对其进行探索。一种方法是使用这个方便的 df_types 函数[^1],它会返回一个 tibble,每行对应一列:
df_types <- function(df) {
  tibble(
    col_name = names(df),
    col_type = map_chr(df, vctrs::vec_ptype_full),
    n_miss = map_int(df, \(x) sum(is.na(x)))
  )
}

df_types(gapminder)
#> # A tibble: 6 × 3
#>   col_name  col_type  n_miss
#>   <chr>     <chr>      <int>
#> 1 year      double         0
#> 2 country   character      0
#> 3 continent character      0
#> 4 lifeExp   double         0
#> 5 pop       double         0
#> 6 gdpPercap double         0
You can then apply this function to all of the files, and maybe do some pivoting to make it easier to see where the differences are. For example, this makes it easy to verify that the gapminder spreadsheets that we’ve been working with are all quite homogeneous:
然后,你可以将此函数应用于所有文件,并可能进行一些透视操作,以便更容易地查看差异所在。例如,这可以轻松验证我们一直在使用的 gapminder 电子表格都非常同质:
files |>
  map(df_types) |>
  list_rbind(names_to = "file_name") |>
  select(-n_miss) |>
  pivot_wider(names_from = col_name, values_from = col_type)
#> # A tibble: 12 × 6
#>   file_name country   continent lifeExp pop    gdpPercap
#>   <chr>     <chr>     <chr>     <chr>   <chr>  <chr>
#> 1 1952.xlsx character character double  double double
#> 2 1957.xlsx character character double  double double
#> 3 1962.xlsx character character double  double double
#> 4 1967.xlsx character character double  double double
#> 5 1972.xlsx character character double  double double
#> 6 1977.xlsx character character double  double double
#> # ℹ 6 more rows
If the files have heterogeneous formats, you might need to do more processing before you can successfully merge them. Unfortunately, we’re now going to leave you to figure that out on your own, but you might want to read about map_if() and map_at(). map_if() allows you to selectively modify elements of a list based on their values; map_at() allows you to selectively modify elements based on their names.
如果文件具有异构格式,你可能需要进行更多处理才能成功合并它们。不幸的是,现在我们将让你自己去解决这个问题,但你可能想了解一下 map_if() 和 map_at()。map_if() 允许你根据列表元素的值选择性地修改它们;map_at() 允许你根据列表元素的名称选择性地修改它们。
26.3.8 Handling failures
Sometimes the structure of your data might be sufficiently wild that you can’t even read all the files with a single command. And then you’ll encounter one of the downsides of map(): it succeeds or fails as a whole. map() will either successfully read all of the files in a directory or fail with an error, reading zero files. This is annoying: why does one failure prevent you from accessing all the other successes?
有时,你的数据结构可能非常混乱,以至于你甚至无法用一个命令读取所有文件。然后你会遇到 map() 的一个缺点:它要么整体成功,要么整体失败。map() 要么成功读取目录中的所有文件,要么因错误而失败,读取零个文件。这很烦人:为什么一个失败会阻止你访问所有其他成功的结果?
Luckily, purrr comes with a helper to tackle this problem: possibly(). possibly() is what’s known as a function operator: it takes a function and returns a function with modified behavior. In particular, possibly() changes a function from erroring to returning a value that you specify:
幸运的是,purrr 提供了一个辅助函数来解决这个问题:possibly()。possibly() 被称为函数操作符:它接受一个函数并返回一个行为被修改了的函数。具体来说,possibly() 将一个会出错的函数更改为返回你指定的值:
files <- paths |>
  map(possibly(\(path) readxl::read_excel(path), NULL))

data <- files |> list_rbind()
This works particularly well here because list_rbind(), like many tidyverse functions, automatically ignores NULLs.
这在这里特别有效,因为 list_rbind() 和许多 tidyverse 函数一样,会自动忽略 NULL 值。
Now you have all the data that can be read easily, and it’s time to tackle the hard part of figuring out why some files failed to load and what to do about it. Start by getting the paths that failed:
现在你已经有了所有可以轻松读取的数据,是时候解决困难的部分了:弄清楚为什么有些文件加载失败以及如何处理。首先获取失败的路径:
failed <- map_vec(files, is.null)
paths[failed]
#> character(0)
Then call the import function again for each failure and figure out what went wrong.
然后对每个失败的文件再次调用导入函数,找出问题所在。
26.4 Saving multiple outputs
In the last section, you learned about map(), which is useful for reading multiple files into a single object. In this section, we’ll now explore sort of the opposite problem: how can you take one or more R objects and save it to one or more files? We’ll explore this challenge using three examples:
在上一节中,你学习了 map(),它对于将多个文件读入单个对象很有用。在本节中,我们将探讨一个相反的问题:如何将一个或多个 R 对象保存到一个或多个文件中?我们将通过三个例子来探讨这个挑战:
Saving multiple data frames into one database.
将多个数据框保存到一个数据库中。Saving multiple data frames into multiple
.csvfiles.
将多个数据框保存到多个.csv文件中。Saving multiple plots to multiple
.pngfiles.
将多个图保存到多个.png文件中。
26.4.1 Writing to a database
Sometimes when working with many files at once, it’s not possible to fit all your data into memory at once, and you can’t do map(files, read_csv). One approach to deal with this problem is to load your data into a database so you can access just the bits you need with dbplyr.
有时,当一次处理多个文件时,不可能将所有数据一次性装入内存,也就无法执行 map(files, read_csv)。解决这个问题的一种方法是将数据加载到数据库中,这样你就可以使用 dbplyr 只访问你需要的部分。
If you’re lucky, the database package you’re using will provide a handy function that takes a vector of paths and loads them all into the database. This is the case with duckdb’s duckdb_read_csv():
如果幸运的话,你使用的数据库包会提供一个方便的函数,该函数接受一个路径向量并将它们全部加载到数据库中。duckdb 的 duckdb_read_csv() 就是这种情况:
con <- DBI::dbConnect(duckdb::duckdb())
duckdb::duckdb_read_csv(con, "gapminder", paths)
This would work well here, but we don’t have csv files, instead we have excel spreadsheets. So we’re going to have to do it “by hand”. Learning to do it by hand will also help you when you have a bunch of csvs and the database that you’re working with doesn’t have one function that will load them all in.
这在这里会很有效,但我们没有 csv 文件,而是 excel 电子表格。所以我们必须“手动”来做。当你有一堆 csv 文件,而你正在使用的数据库没有一个能将它们全部加载的函数时,学会手动操作也会对你有所帮助。
We need to start by creating a table that we will fill in with data. The easiest way to do this is by creating a template, a dummy data frame that contains all the columns we want, but only a sampling of the data. For the gapminder data, we can make that template by reading a single file and adding the year to it:
我们需要从创建一个我们将用数据填充的表开始。最简单的方法是创建一个模板,一个包含我们想要的所有列但只有少量示例数据的虚拟数据框。对于 gapminder 数据,我们可以通过读取单个文件并向其添加年份来制作该模板:
template <- readxl::read_excel(paths[[1]])
template$year <- 1952
template
#> # A tibble: 142 × 6
#>   country     continent lifeExp      pop gdpPercap  year
#>   <chr>       <chr>       <dbl>    <dbl>     <dbl> <dbl>
#> 1 Afghanistan Asia         28.8  8425333      779.  1952
#> 2 Albania     Europe       55.2  1282697     1601.  1952
#> 3 Algeria     Africa       43.1  9279525     2449.  1952
#> 4 Angola      Africa       30.0  4232095     3521.  1952
#> 5 Argentina   Americas     62.5 17876956     5911.  1952
#> 6 Australia   Oceania      69.1  8691212    10040.  1952
#> # ℹ 136 more rows
Now we can connect to the database, and use DBI::dbCreateTable() to turn our template into a database table:
现在我们可以连接到数据库,并使用 DBI::dbCreateTable() 将我们的模板转换成一个数据库表:
con <- DBI::dbConnect(duckdb::duckdb())
DBI::dbCreateTable(con, "gapminder", template)
dbCreateTable() doesn’t use the data in template, just the variable names and types. So if we inspect the gapminder table now you’ll see that it’s empty but it has the variables we need with the types we expect:dbCreateTable() 不会使用 template 中的数据,只使用变量名和类型。所以如果我们现在检查 gapminder 表,你会看到它是空的,但它拥有我们需要的变量和我们期望的类型:
con |> tbl("gapminder")
#> # Source:   table<gapminder> [?? x 6]
#> # Database: DuckDB v1.3.1 [14913@Windows 10 x64:R 4.5.1/:memory:]
#> # ℹ 6 variables: country <chr>, continent <chr>, lifeExp <dbl>, pop <dbl>,
#> #   gdpPercap <dbl>, year <dbl>
Next, we need a function that takes a single file path, reads it into R, and adds the result to the gapminder table. We can do that by combining read_excel() with DBI::dbAppendTable():
接下来,我们需要一个函数,它接受单个文件路径,将其读入 R,并将结果添加到 gapminder 表中。我们可以通过结合 read_excel() 和 DBI::dbAppendTable() 来实现:
append_file <- function(path) {
  df <- readxl::read_excel(path)
  df$year <- parse_number(basename(path))

  DBI::dbAppendTable(con, "gapminder", df)
}
Now we need to call append_file() once for each element of paths. That’s certainly possible with map():
现在我们需要对 paths 的每个元素调用一次 append_file()。这当然可以用 map() 实现:
paths |> map(append_file)But we don’t care about the output of append_file(), so instead of map() it’s slightly nicer to use walk(). walk() does exactly the same thing as map() but throws the output away:
但我们不关心 append_file() 的输出,所以使用 walk() 会比 map() 更简洁一些。walk() 的作用与 map() 完全相同,但会丢弃输出:
paths |> walk(append_file)Now we can see if we have all the data in our table:
现在我们可以看看我们的表中是否包含了所有数据:
26.4.2 Writing csv files
The same basic principle applies if we want to write multiple csv files, one for each group. Let’s imagine that we want to take the ggplot2::diamonds data and save one csv file for each clarity. First we need to make those individual datasets. There are many ways you could do that, but there’s one way we particularly like: group_nest().
如果我们想为每个组别写入多个 csv 文件,同样的基本原则也适用。假设我们想要获取 ggplot2::diamonds 数据,并为每个 clarity 保存一个 csv 文件。首先,我们需要创建这些独立的数据集。有很多方法可以做到这一点,但我们特别喜欢一种方法:group_nest()。
by_clarity <- diamonds |>
  group_nest(clarity)

by_clarity
#> # A tibble: 8 × 2
#>   clarity               data
#>   <ord>   <list<tibble[,9]>>
#> 1 I1               [741 × 9]
#> 2 SI2            [9,194 × 9]
#> 3 SI1           [13,065 × 9]
#> 4 VS2           [12,258 × 9]
#> 5 VS1            [8,171 × 9]
#> 6 VVS2           [5,066 × 9]
#> # ℹ 2 more rows
This gives us a new tibble with eight rows and two columns. clarity is our grouping variable and data is a list-column containing one tibble for each unique value of clarity:
这给了我们一个有八行两列的新 tibble。clarity 是我们的分组变量,data 是一个列表列 (list-column),其中包含对应 clarity 每个唯一值的一个 tibble:
by_clarity$data[[1]]
#> # A tibble: 741 × 9
#>   carat cut       color depth table price     x     y     z
#>   <dbl> <ord>     <ord> <dbl> <dbl> <int> <dbl> <dbl> <dbl>
#> 1  0.32 Premium   E      60.9    58   345  4.38  4.42  2.68
#> 2  1.17 Very Good J      60.2    61  2774  6.83  6.9   4.13
#> 3  1.01 Premium   F      61.8    60  2781  6.39  6.36  3.94
#> 4  1.01 Fair      E      64.5    58  2788  6.29  6.21  4.03
#> 5  0.96 Ideal     F      60.7    55  2801  6.37  6.41  3.88
#> 6  1.04 Premium   G      62.2    58  2801  6.46  6.41  4
#> # ℹ 735 more rows
While we’re here, let’s create a column that gives the name of output file, using mutate() and str_glue():
趁此机会,让我们使用 mutate() 和 str_glue() 创建一个包含输出文件名的列:
by_clarity <- by_clarity |>
  mutate(path = str_glue("diamonds-{clarity}.csv"))

by_clarity
#> # A tibble: 8 × 3
#>   clarity               data path
#>   <ord>   <list<tibble[,9]>> <glue>
#> 1 I1               [741 × 9] diamonds-I1.csv
#> 2 SI2            [9,194 × 9] diamonds-SI2.csv
#> 3 SI1           [13,065 × 9] diamonds-SI1.csv
#> 4 VS2           [12,258 × 9] diamonds-VS2.csv
#> 5 VS1            [8,171 × 9] diamonds-VS1.csv
#> 6 VVS2           [5,066 × 9] diamonds-VVS2.csv
#> # ℹ 2 more rows
So if we were going to save these data frames by hand, we might write something like:
因此,如果我们打算手动保存这些数据框,我们可能会写出类似这样的代码:
This is a little different to our previous uses of map() because there are two arguments that are changing, not just one. That means we need a new function: map2(), which varies both the first and second arguments. And because we again don’t care about the output, we want walk2() rather than map2(). That gives us:
这与我们之前使用 map() 的情况略有不同,因为有两个参数在变化,而不仅仅是一个。这意味着我们需要一个新的函数:map2(),它可以同时改变第一个和第二个参数。而且因为我们同样不关心输出,所以我们想要用 walk2() 而不是 map2()。这样我们得到:
walk2(by_clarity$data, by_clarity$path, write_csv)26.4.3 Saving plots
We can take the same basic approach to create many plots. Let’s first make a function that draws the plot we want:
我们可以采取同样的基本方法来创建多个图。首先,让我们创建一个函数来绘制我们想要的图:
carat_histogram <- function(df) {
  ggplot(df, aes(x = carat)) + geom_histogram(binwidth = 0.1)
}

carat_histogram(by_clarity$data[[1]])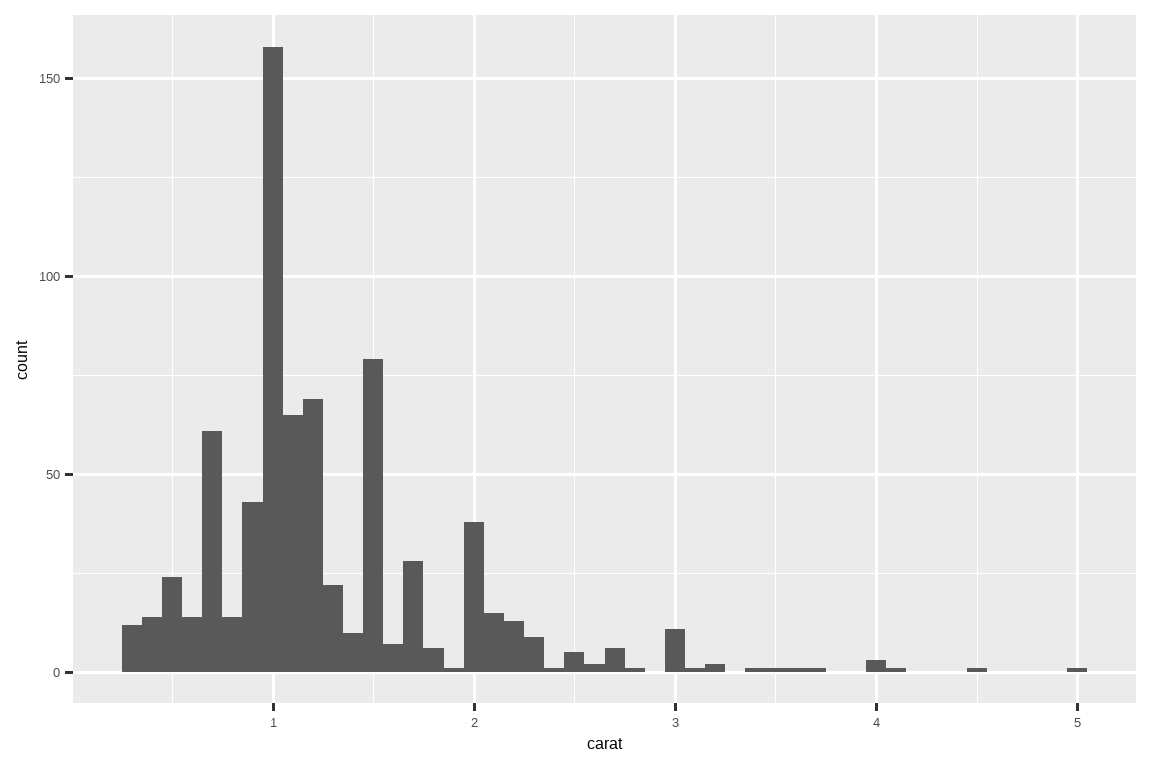
Now we can use map() to create a list of many plots[^5] and their eventual file paths:
现在我们可以使用 map() 来创建许多图的列表5及其最终的文件路径:
Then use walk2() with ggsave() to save each plot:
然后使用 walk2() 和 ggsave() 来保存每个图:
This is shorthand for:
这是以下代码的简写:
26.5 Summary
In this chapter, you’ve seen how to use explicit iteration to solve three problems that come up frequently when doing data science: manipulating multiple columns, reading multiple files, and saving multiple outputs. But in general, iteration is a super power: if you know the right iteration technique, you can easily go from fixing one problem to fixing all the problems. Once you’ve mastered the techniques in this chapter, we highly recommend learning more by reading the Functionals chapter of Advanced R and consulting the purrr website.
在本章中,你已经学习了如何使用显式迭代来解决数据科学中经常出现的三个问题:操作多个列、读取多个文件以及保存多个输出。但总的来说,迭代是一项超能力:如果你掌握了正确的迭代技巧,你就可以轻松地从解决一个问题扩展到解决所有问题。一旦你掌握了本章的技巧,我们强烈建议你通过阅读 Advanced R 的 函数式编程 (Functionals) 章节 和查阅 purrr 网站 来学习更多内容。
If you know much about iteration in other languages, you might be surprised that we didn’t discuss the for loop. That’s because R’s orientation towards data analysis changes how we iterate: in most cases you can rely on an existing idiom to do something to each columns or each group. And when you can’t, you can often use a functional programming tool like map() that does something to each element of a list. However, you will see for loops in wild-caught code, so you’ll learn about them in the next chapter where we’ll discuss some important base R tools.
如果你对其他语言中的迭代很了解,你可能会惊讶于我们没有讨论 for 循环。这是因为 R 面向数据分析的特性改变了我们迭代的方式:在大多数情况下,你可以依赖现有的惯用法来对每一列或每一组执行操作。当你无法这样做时,你通常可以使用像 map() 这样的函数式编程工具,它会对列表的每个元素执行某些操作。然而,你会在实际代码中看到 for 循环,所以你将在下一章中学习它们,届时我们将讨论一些重要的 R 基础工具。