Show/Hide Code
ggplot(iris, aes(x = Species, y = Sepal.Length)) +
  geom_violin()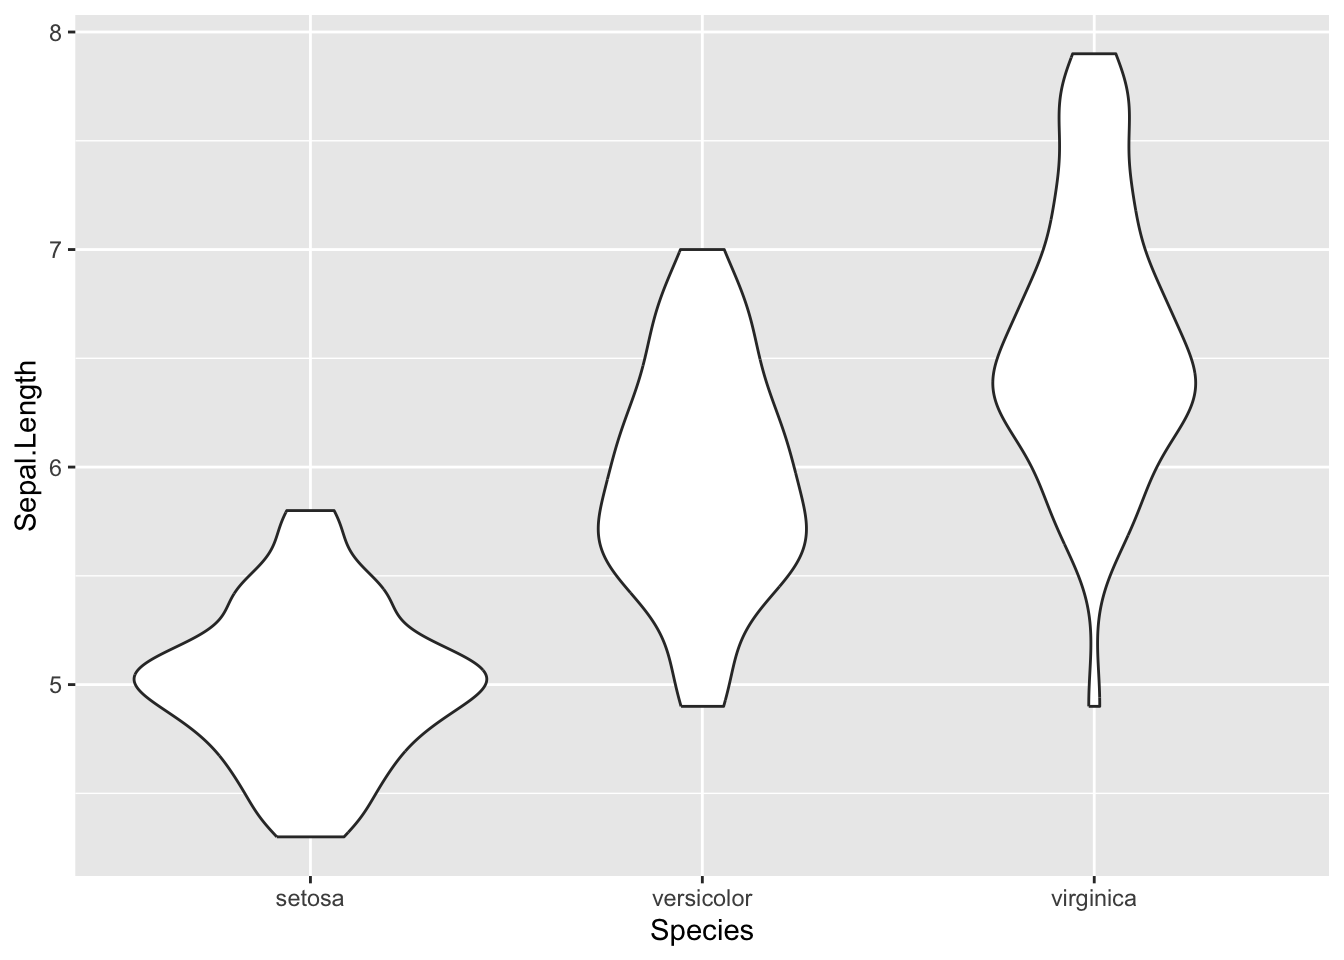
ggplot2::geom_violin() 或 base R::vioplot 可以绘制小提琴图。
小提琴图是箱线图的变体, 弥补了箱线图隐藏数据点的缺点。(箱线图陷阱)
小提琴图是一种强大的可视化技术, 允许比较多个组的数量和分布,但是使用频率低于箱线图,我不理解.
如果数据量少(几百个),还可以叠加散点.
ggplot(iris, aes(x = Species, y = Sepal.Length)) +
geom_violin()
library(tidyverse)

ggplot(iris, aes(x = Species, y = Sepal.Length, fill = Species)) +
  geom_violin(alpha = 0.5) +
  theme_minimal() +
theme(legend.position = "none") 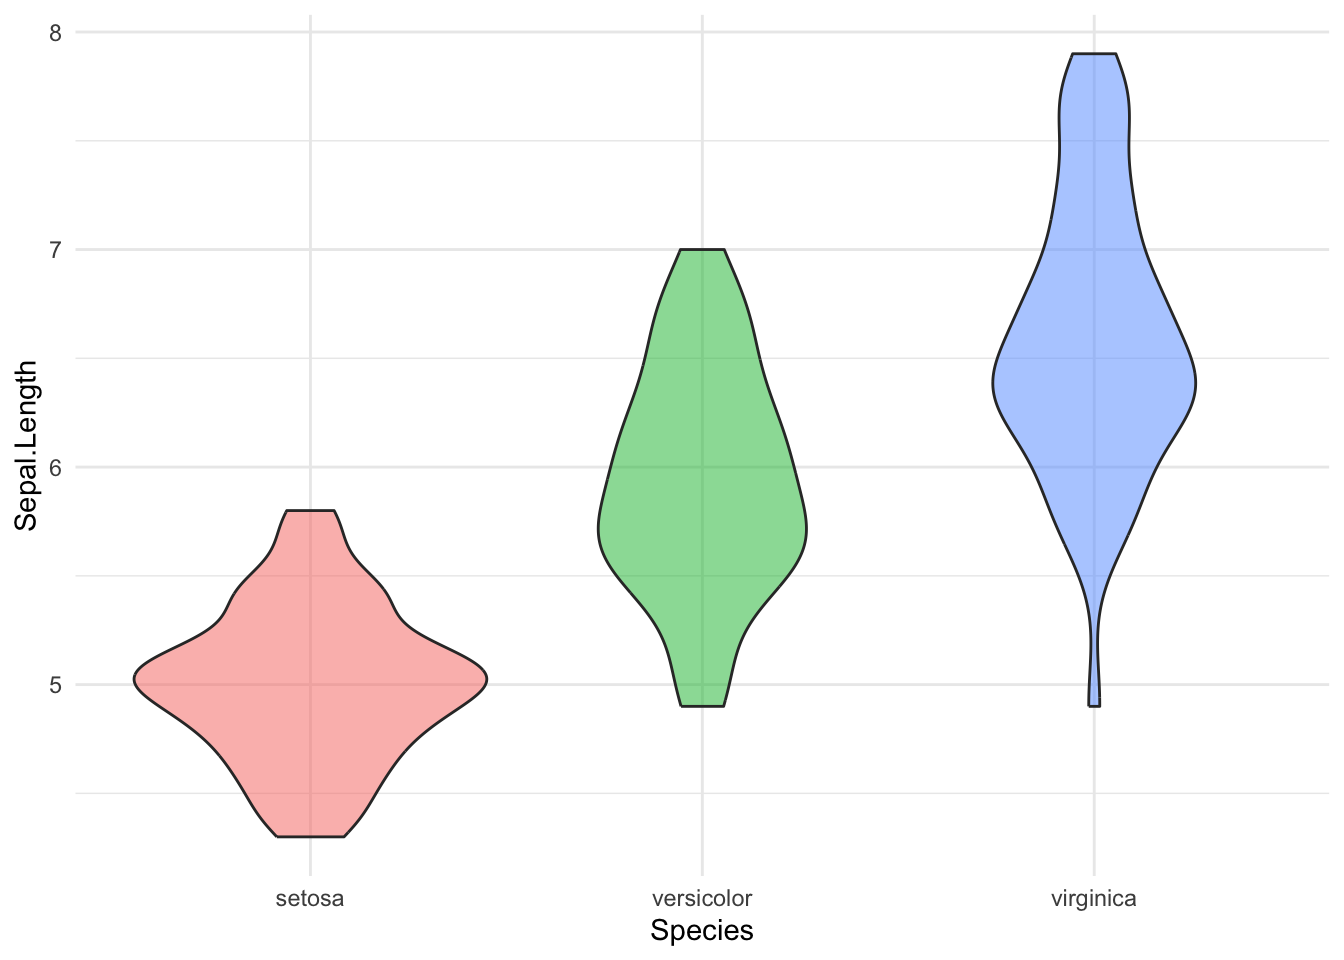
wider格式数据转化为long格式数据后, 再使用geom_violin()绘制小提琴图。
knitr::kable(head(iris))| Sepal.Length | Sepal.Width | Petal.Length | Petal.Width | Species |
|---|---|---|---|---|
| 5.1 | 3.5 | 1.4 | 0.2 | setosa |
| 4.9 | 3.0 | 1.4 | 0.2 | setosa |
| 4.7 | 3.2 | 1.3 | 0.2 | setosa |
| 4.6 | 3.1 | 1.5 | 0.2 | setosa |
| 5.0 | 3.6 | 1.4 | 0.2 | setosa |
| 5.4 | 3.9 | 1.7 | 0.4 | setosa |
iris数据(wider格式数据)
tidyr::gather() 是个有意思的函数,可以将wider格式数据转化为long格式数据。
iris_long <- iris |>
  gather(key = "type", value = "value", -Species)

knitr::kable(head(iris_long))| Species | type | value |
|---|---|---|
| setosa | Sepal.Length | 5.1 |
| setosa | Sepal.Length | 4.9 |
| setosa | Sepal.Length | 4.7 |
| setosa | Sepal.Length | 4.6 |
| setosa | Sepal.Length | 5.0 |
| setosa | Sepal.Length | 5.4 |
iris数据(wider格式数据转化为long格式后)
table(iris_long$type)
Petal.Length  Petal.Width Sepal.Length  Sepal.Width
150 150 150 150 ggplot(iris_long, aes(x = type, y = value)) +
geom_violin()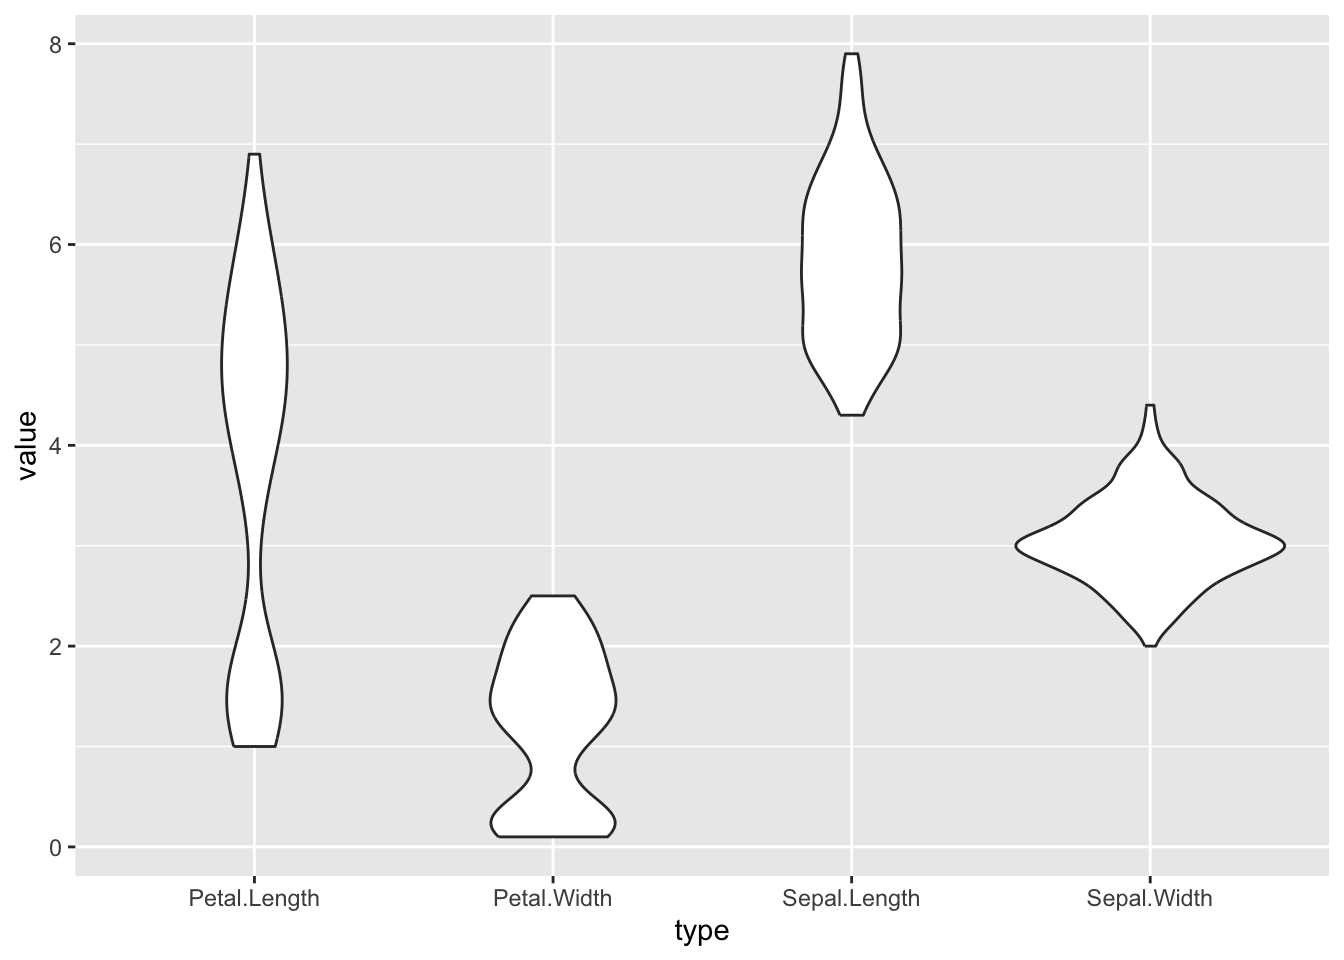
有多种方法: forcats::fct_reorder(), dplyr::arrange() base R::reorder()等,我一般用forcats::fct_reorder(), 另外两种方法见Reorder a variable with ggplot2。
iris_long |>
  # 重点是这里的fct_reorder
  ggplot(aes(x = fct_reorder(type, value, .fun = median), y = value, fill = type)) +
  geom_violin(alpha = 0.5) +
  theme_minimal() +
  theme(legend.position = "none")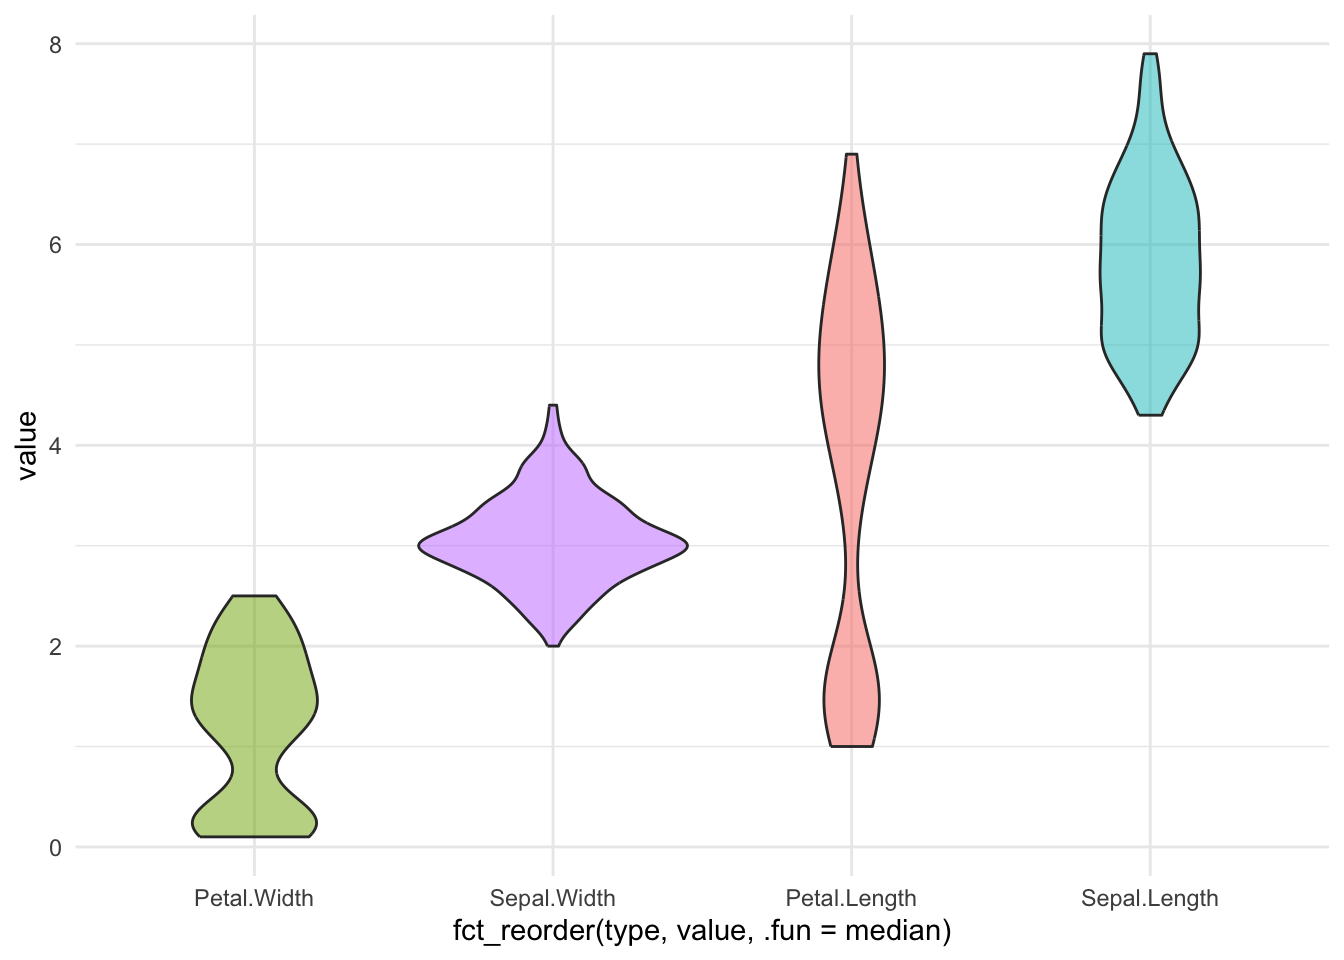
注意,如果X已经有顺序,比如月份等,就不适合使用fct_reorder()。
有几种方法可以设置小提琴图为横向显示。
coord_flip()coord_flip()是比较落后的方式,纯粹是简单粗暴的翻转(回归线基于旋转前;调整坐标轴scale基于旋转前,反直觉), 现在优先考虑aes()交换x和y的参数,ggplot会自动识别方向,如果识别错误,可以使用orientation = "y"。
iris_long |>
  ggplot(aes(x = value, y = fct_reorder(type, value, .fun = median), fill = type)) +
  geom_violin(alpha = 0.5) +
  theme_minimal() +
theme(legend.position = "none") 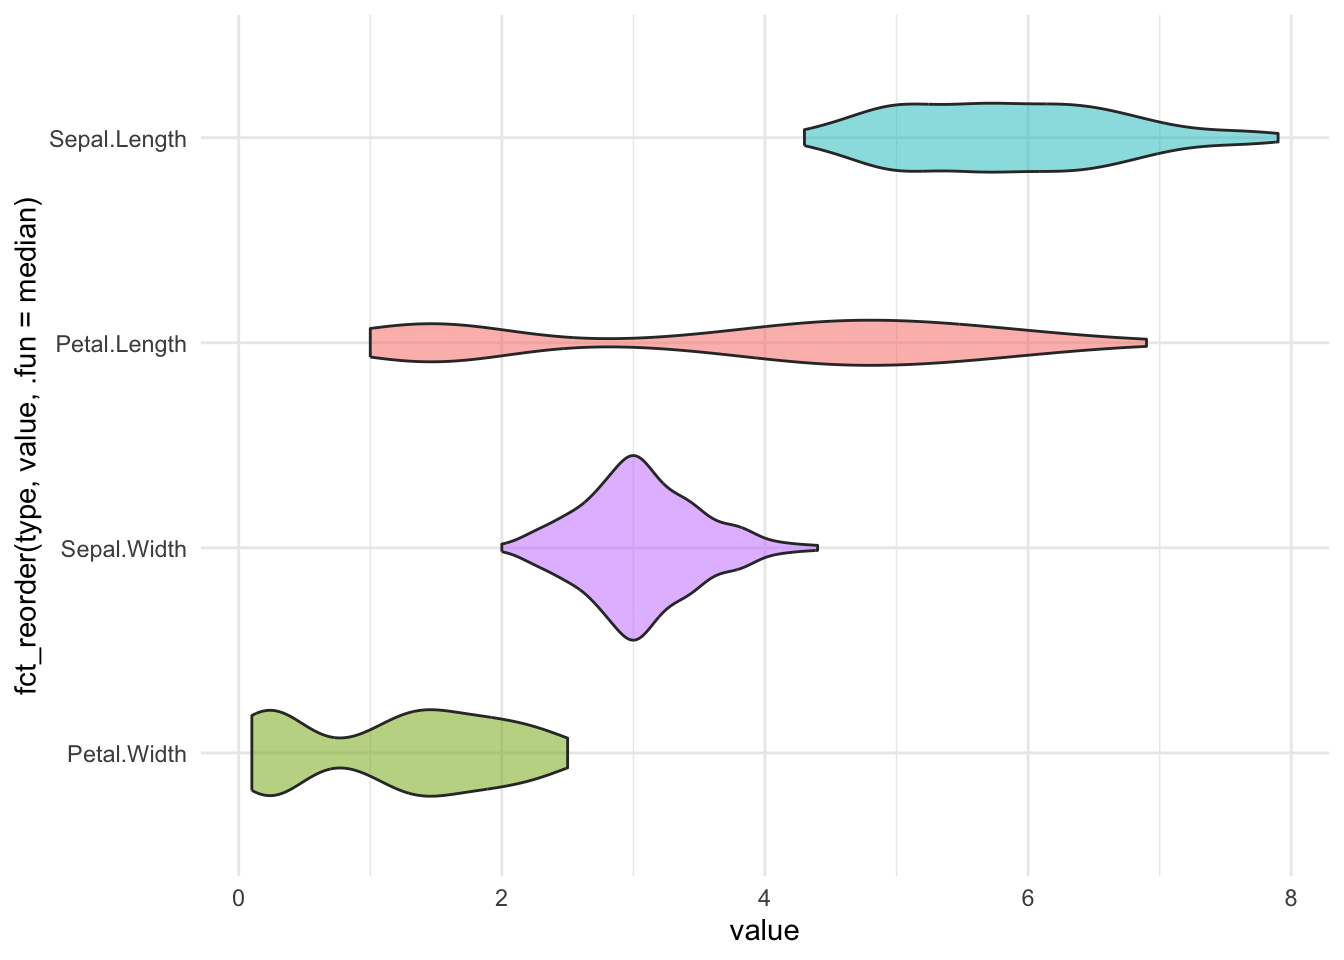
使用geom_boxplot()和geom_violin()结合,可以同时显示小提琴图和箱线图。 注意: 调整geom_boxplot()的宽度,并且白色(fill仅放入geom_violin()),使其更美观。
iris_long |>
  ggplot(aes(x = type, y = value)) +
  geom_violin(aes(fill = type), alpha = 0.5) +
  geom_boxplot(width = 0.05) +
theme(legend.position = "none") 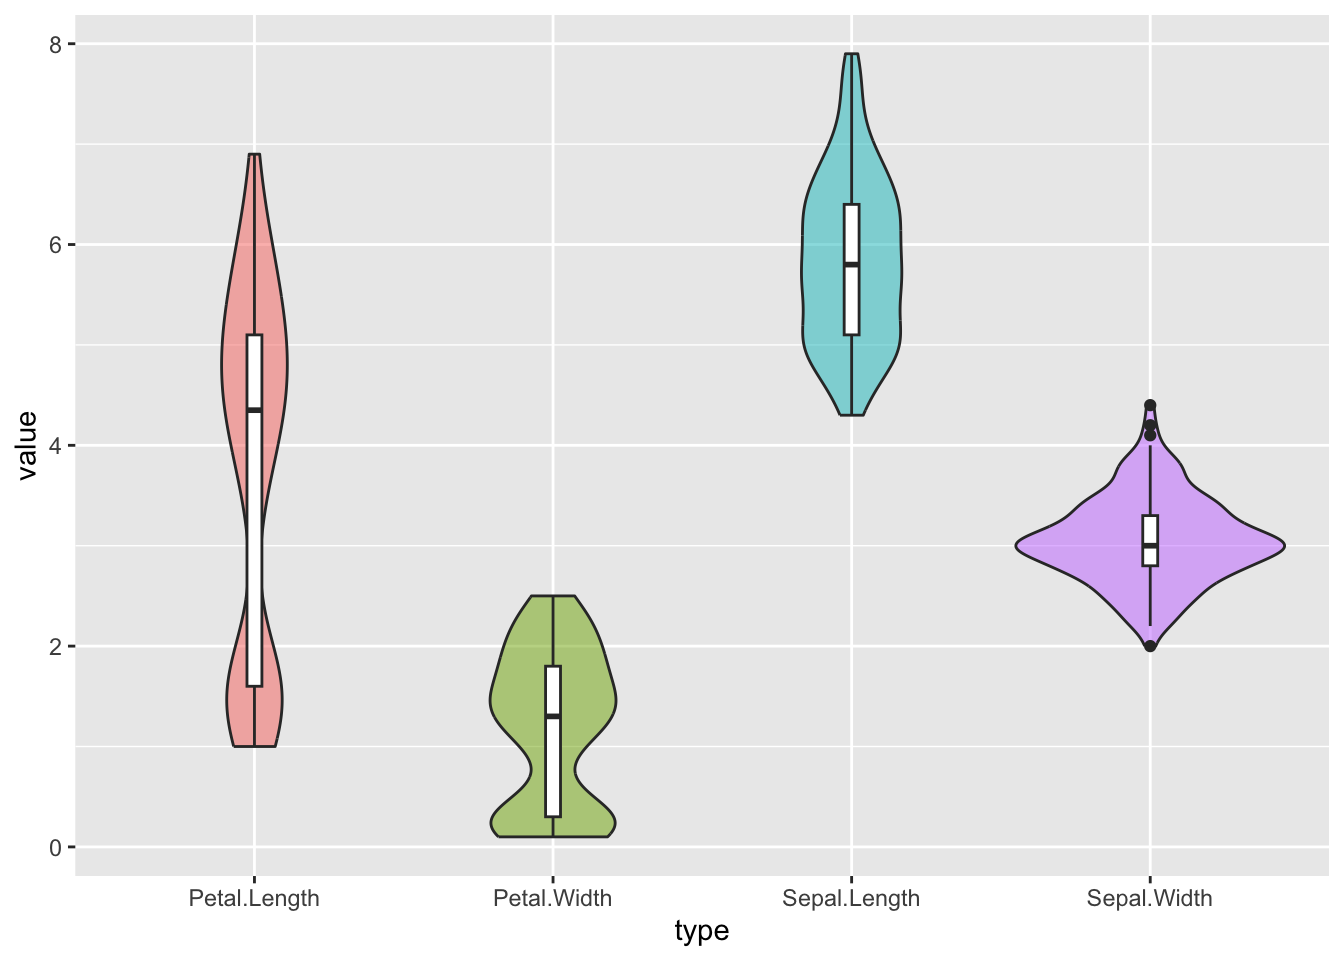
还可以用fill增加分组.
ggplot(iris_long, aes(x = type, y = value, fill = Species)) +
  geom_violin() +
  theme(legend.position = "bottom")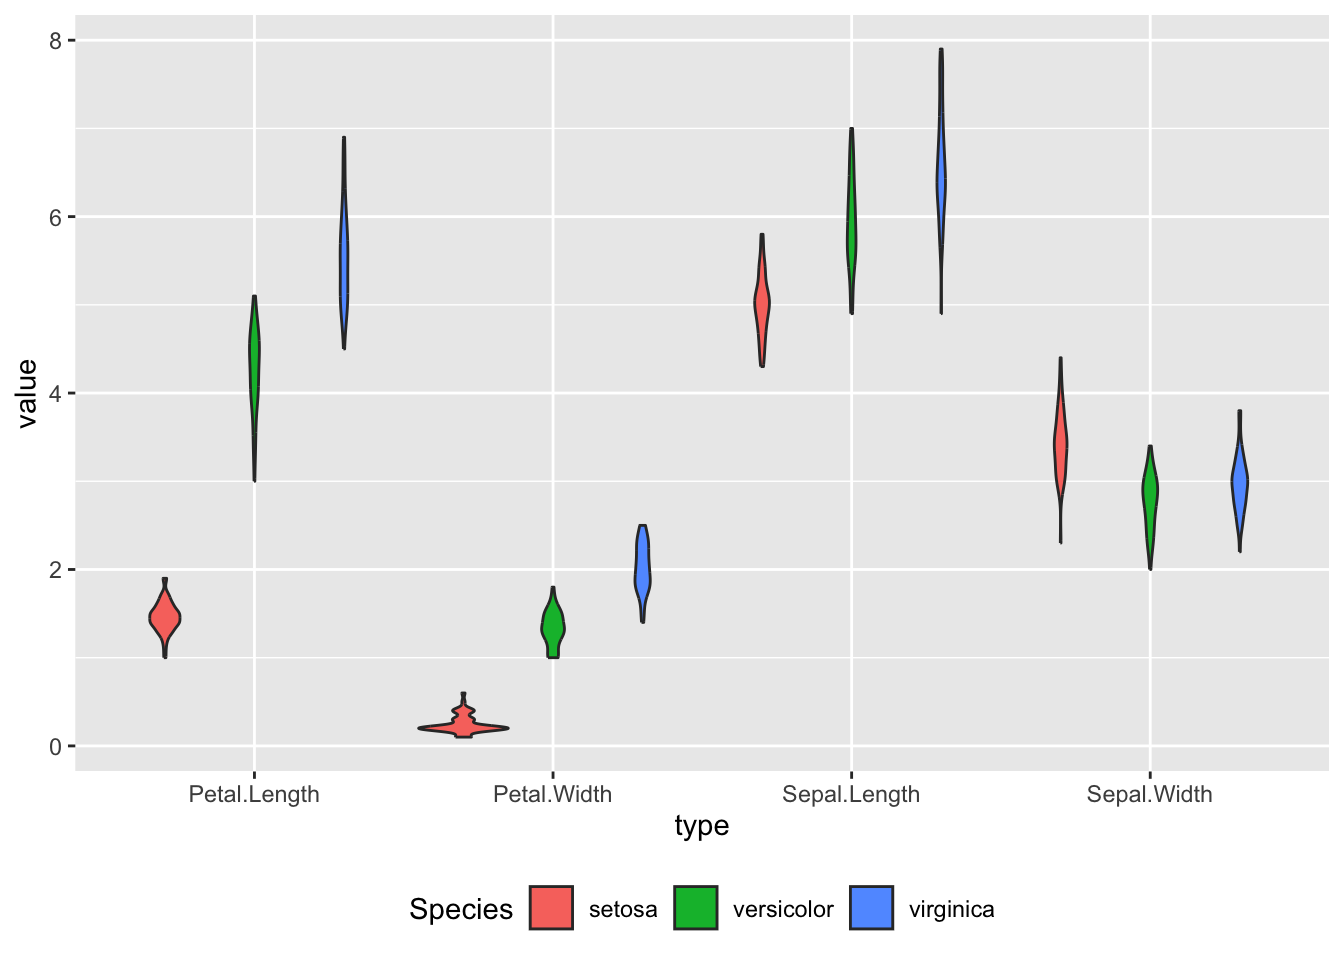
r-graph-gallery 有base R::vioplot的 小提琴图示例
一种非常美观的带有统计量的小提琴图,见 Section 3.5