群蜂图,像蜂群一样展示数据,使用R包beeswarm 和 ggbeeswarm 包实现。
iris
iris数据集,又称为“安德森鸢尾花卉数据集”(Anderson’s Iris data set),是 R 语言内置的一个“玩具”数据集,也是统计学、数据科学和机器学习领域中使用最频繁、最著名的示例数据集之一。
它包含了150个鸢尾花样本的测量数据,这150个样本分别来自三个不同的鸢尾花品种:山鸢尾 (Setosa)、变色鸢尾 (Versicolor) 和 维吉尼亚鸢尾 (Virginica),每个品种各50个样本。
Show/Hide Code
library(beeswarm)
library(ggplot2)
library(ggbeeswarm)
data(iris)
knitr::kable(head(iris))
| 5.1 |
3.5 |
1.4 |
0.2 |
setosa |
| 4.9 |
3.0 |
1.4 |
0.2 |
setosa |
| 4.7 |
3.2 |
1.3 |
0.2 |
setosa |
| 4.6 |
3.1 |
1.5 |
0.2 |
setosa |
| 5.0 |
3.6 |
1.4 |
0.2 |
setosa |
| 5.4 |
3.9 |
1.7 |
0.4 |
setosa |
群峰图使用的R包和数据集
iris数据集共有5个变量:
- Sepal.Length: 花萼长度,单位是厘米。
- Sepal.Width: 花萼宽度,单位是厘米。
- Petal.Length: 花瓣长度,单位是厘米。
- Petal.Width: 花瓣宽度,单位是厘米。
- Species: 物种/品种,一个因子变量,包含三个水平(levels):setosa, versicolor, 和 virginica。
beeswarm
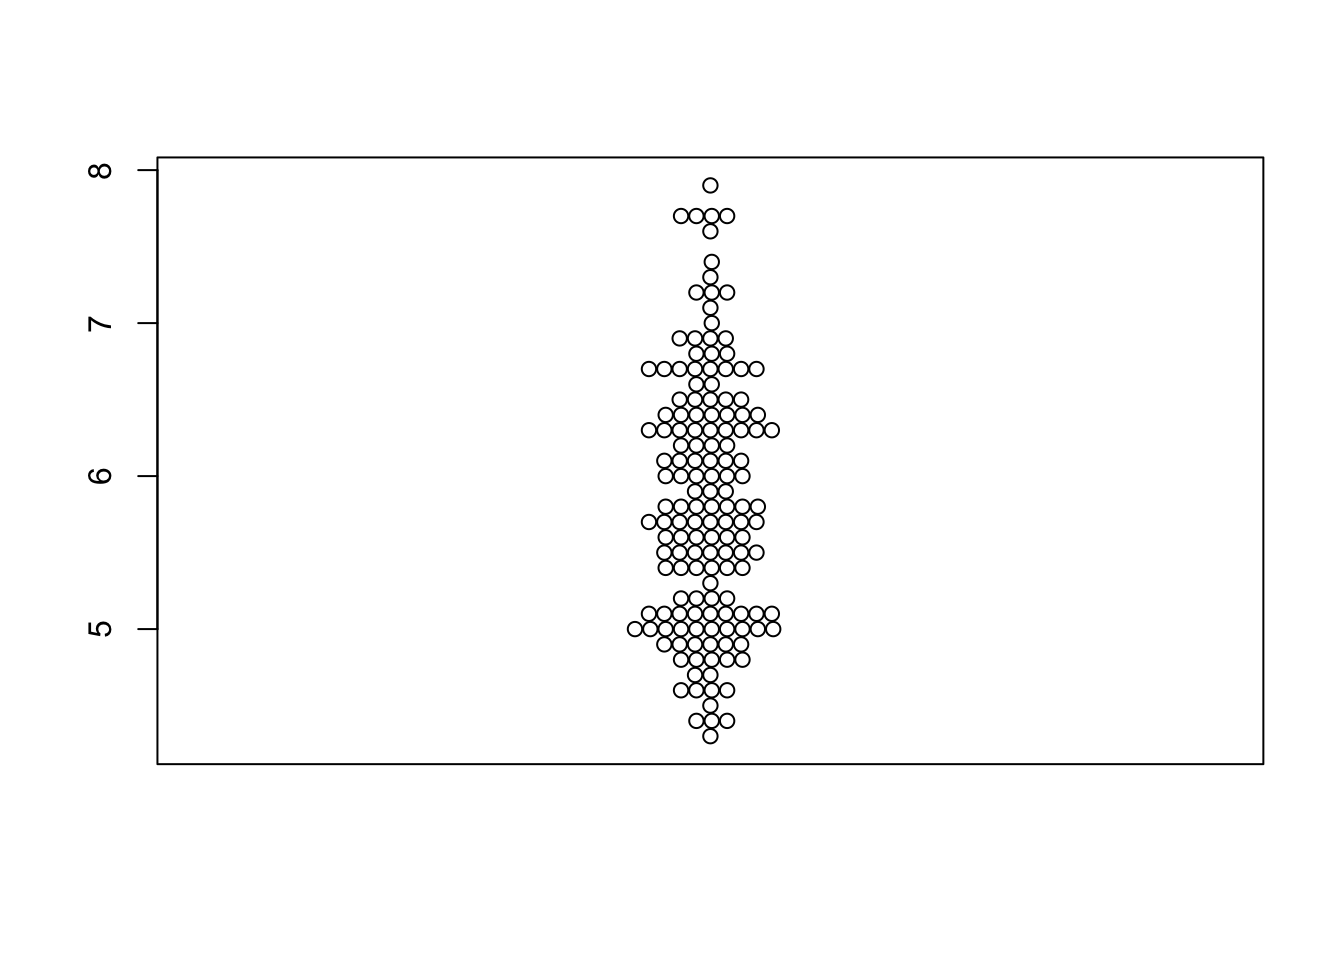
基础
Show/Hide Code
beeswarm(iris$Sepal.Length)
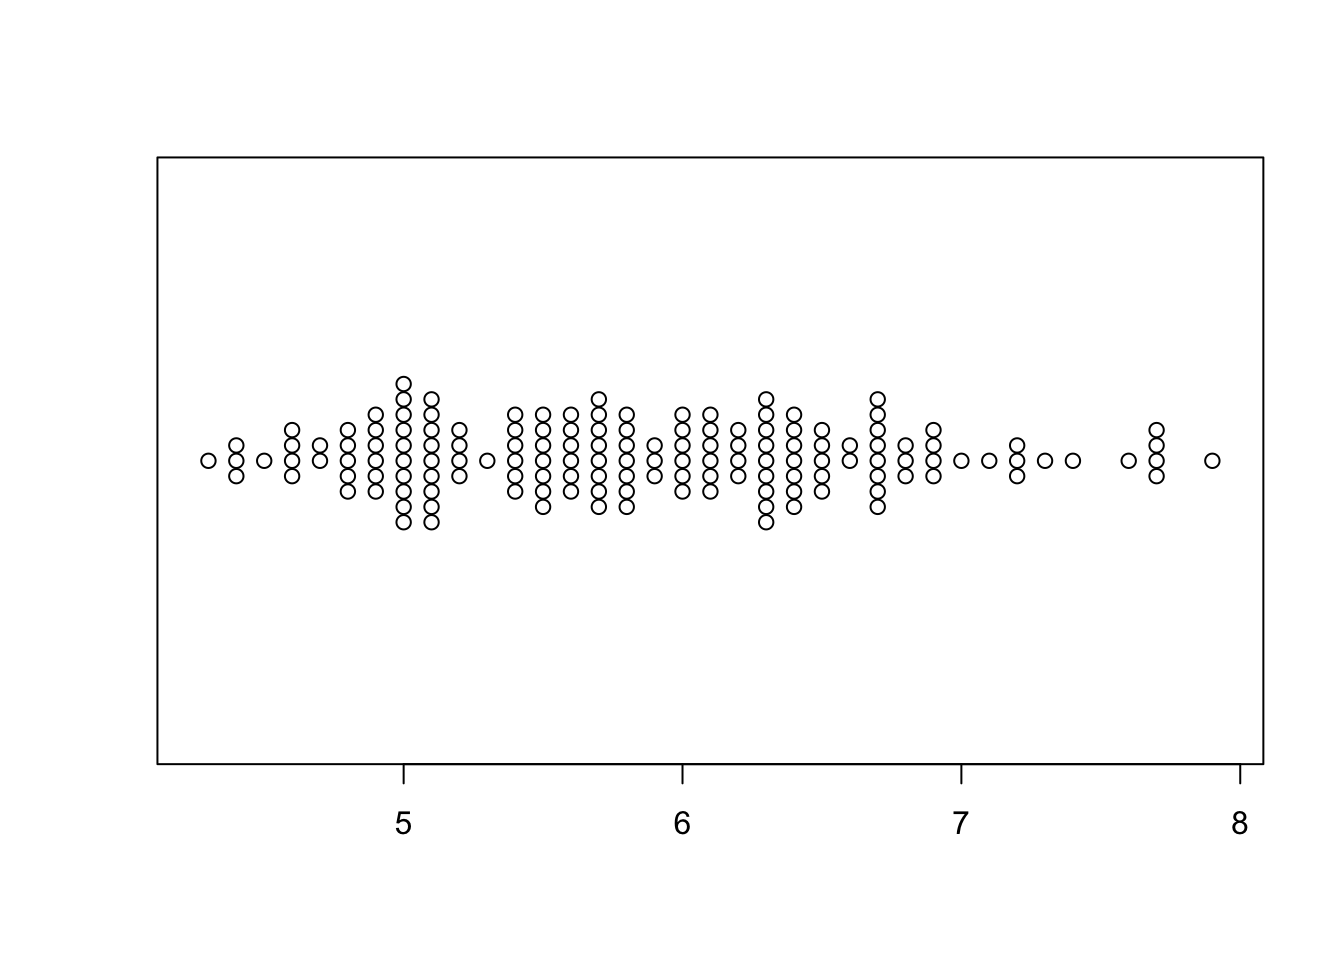
翻转坐标轴
Show/Hide Code
beeswarm(iris$Sepal.Length, horizontal=TRUE)
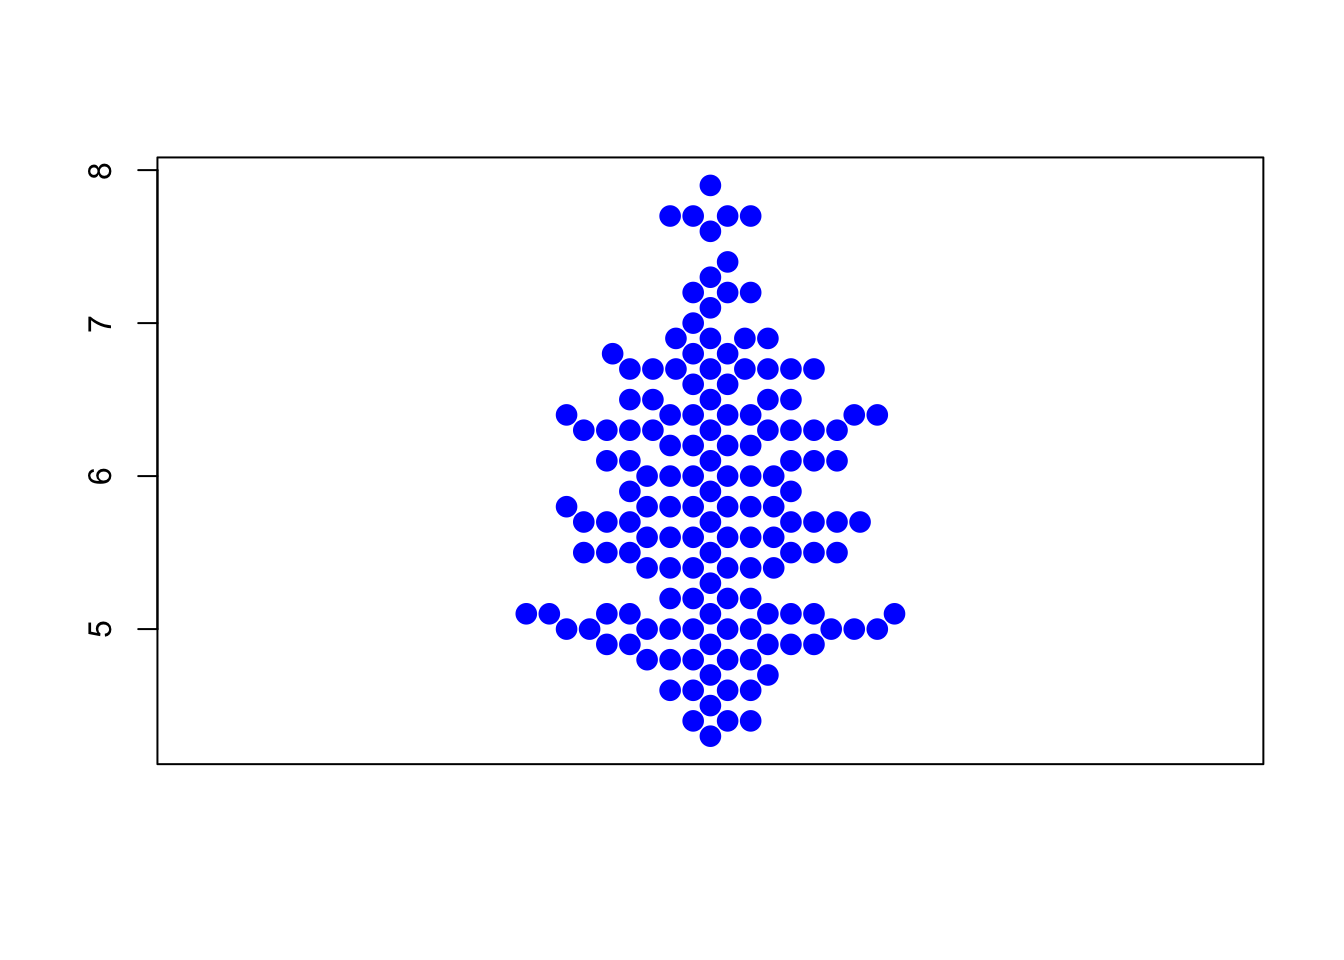
自定义
Show/Hide Code
beeswarm(
  iris$Sepal.Length,
  pch=16, # 点的形状
  col='blue', # 点的颜色
  cex=1.5, # 点的大小
)
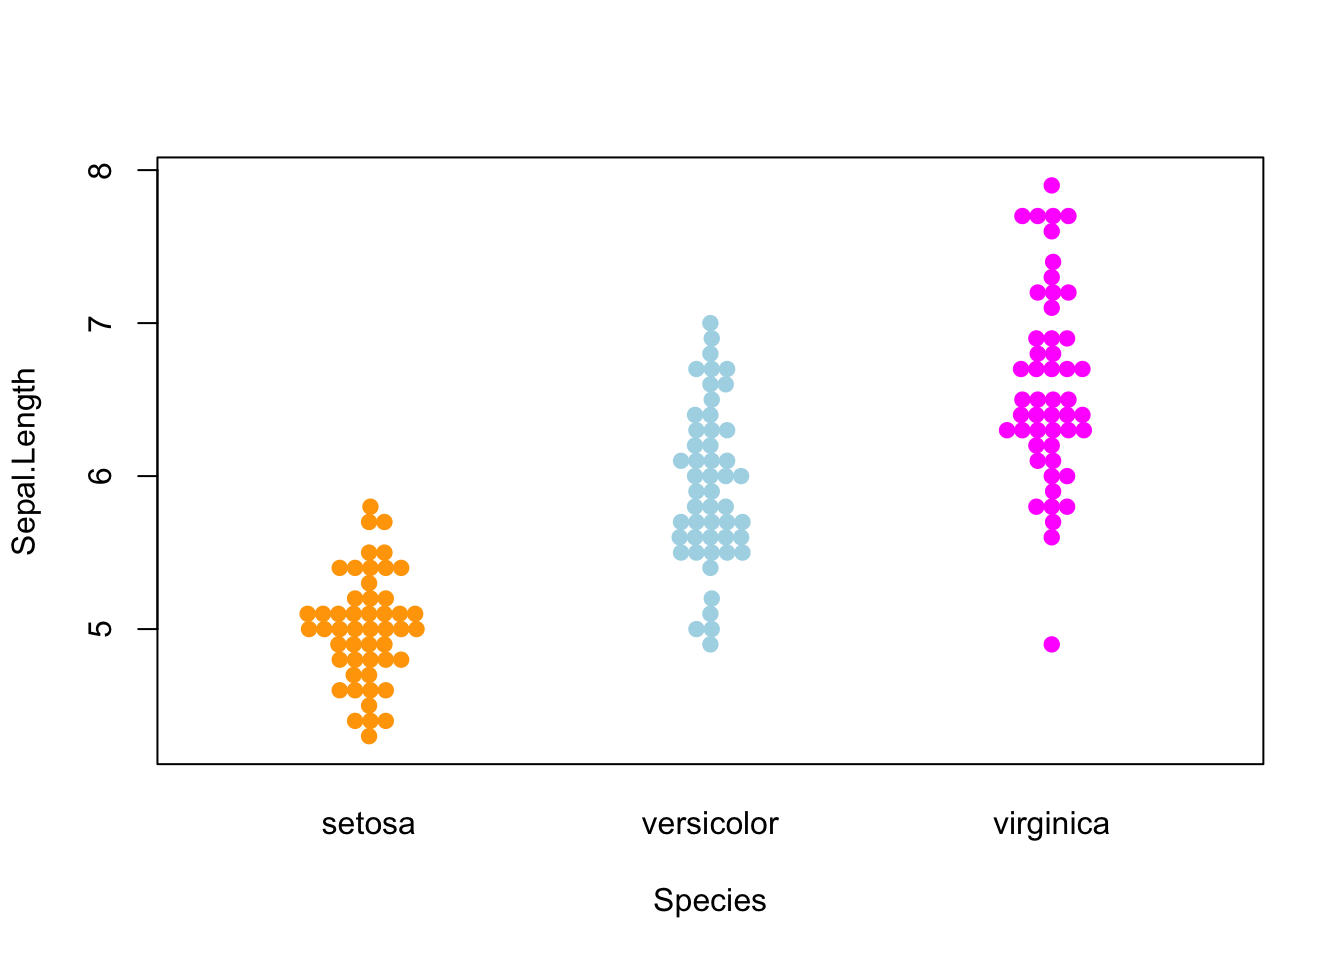
分组
Show/Hide Code
beeswarm(
  Sepal.Length ~ Species,
  data=iris,
  col=c("orange", "lightblue", "magenta"),
  pch = 19, # fill the dots
#   corral = "gutter" # 使用“gutter”方法来处理重叠,边缘裁切
)
更多可以更改的参数见beeswarm包文档。
ggbeeswarm
ggbeeswarm包是ggplot2的扩展包,有两个核心函数:
geom_beeswarm()函数创建群峰图。geom_quasirandom()函数创建准随机分布图,这是一种介于蜂群图和抖动图之间的混合图。
基础
Show/Hide Code
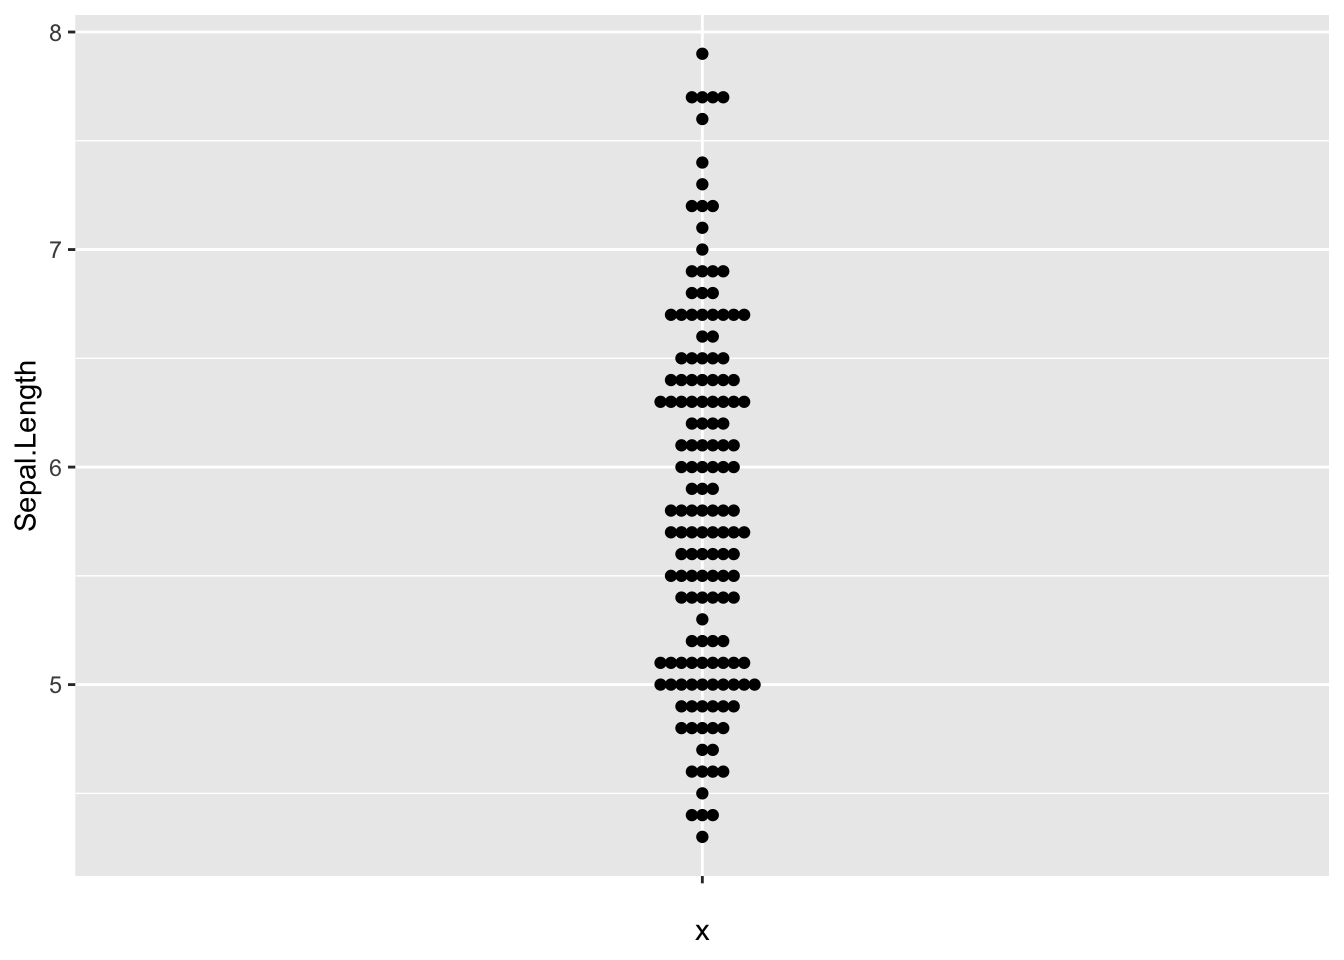
ggplot(iris,aes(y=Sepal.Length,x='')) +
  geom_beeswarm()
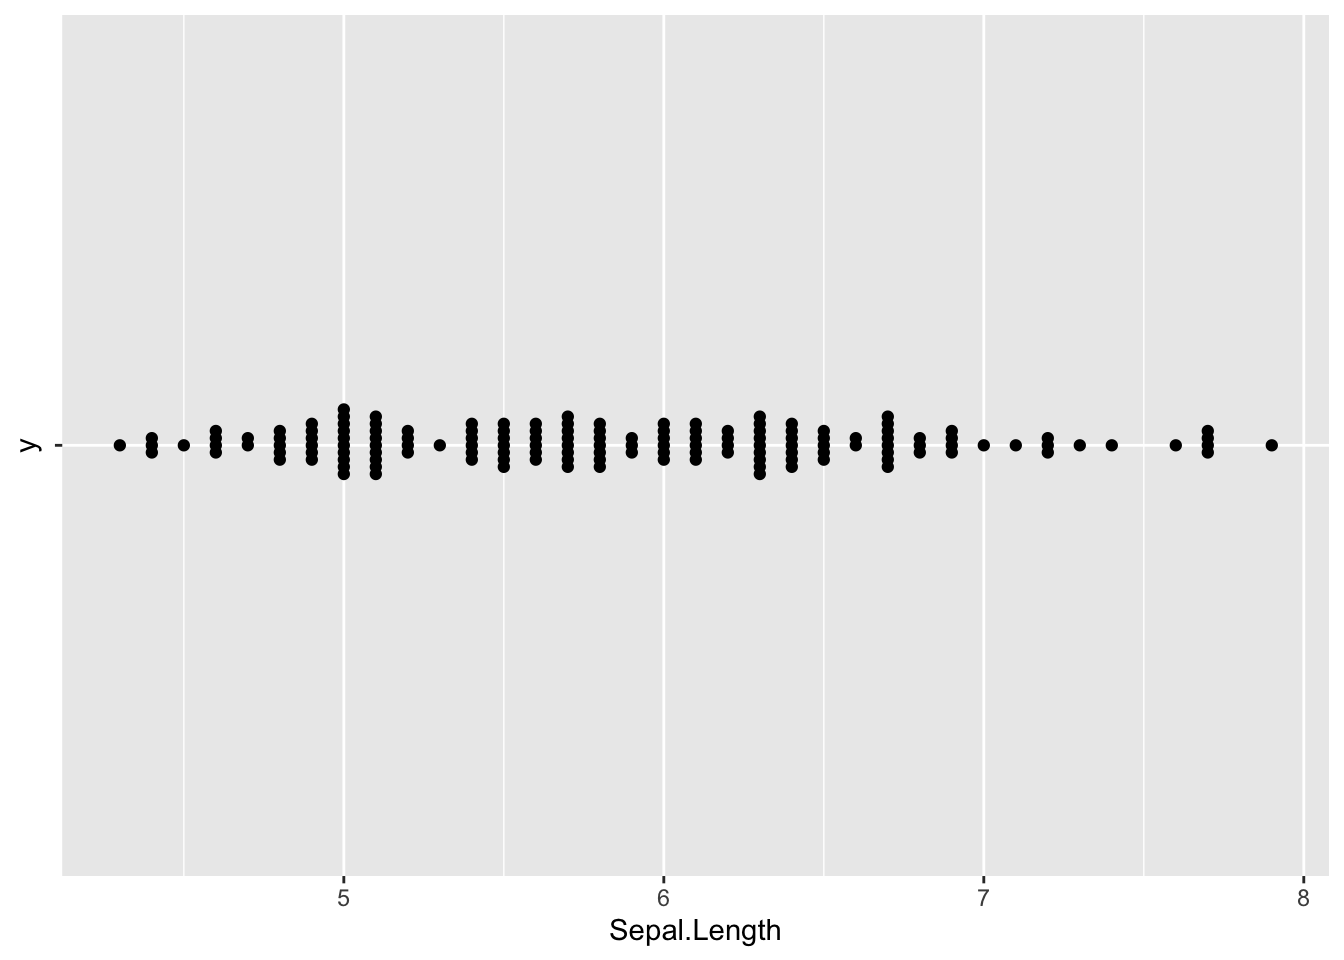
翻转坐标轴
Show/Hide Code
ggplot(iris,aes(x=Sepal.Length,y='')) +
  geom_beeswarm()
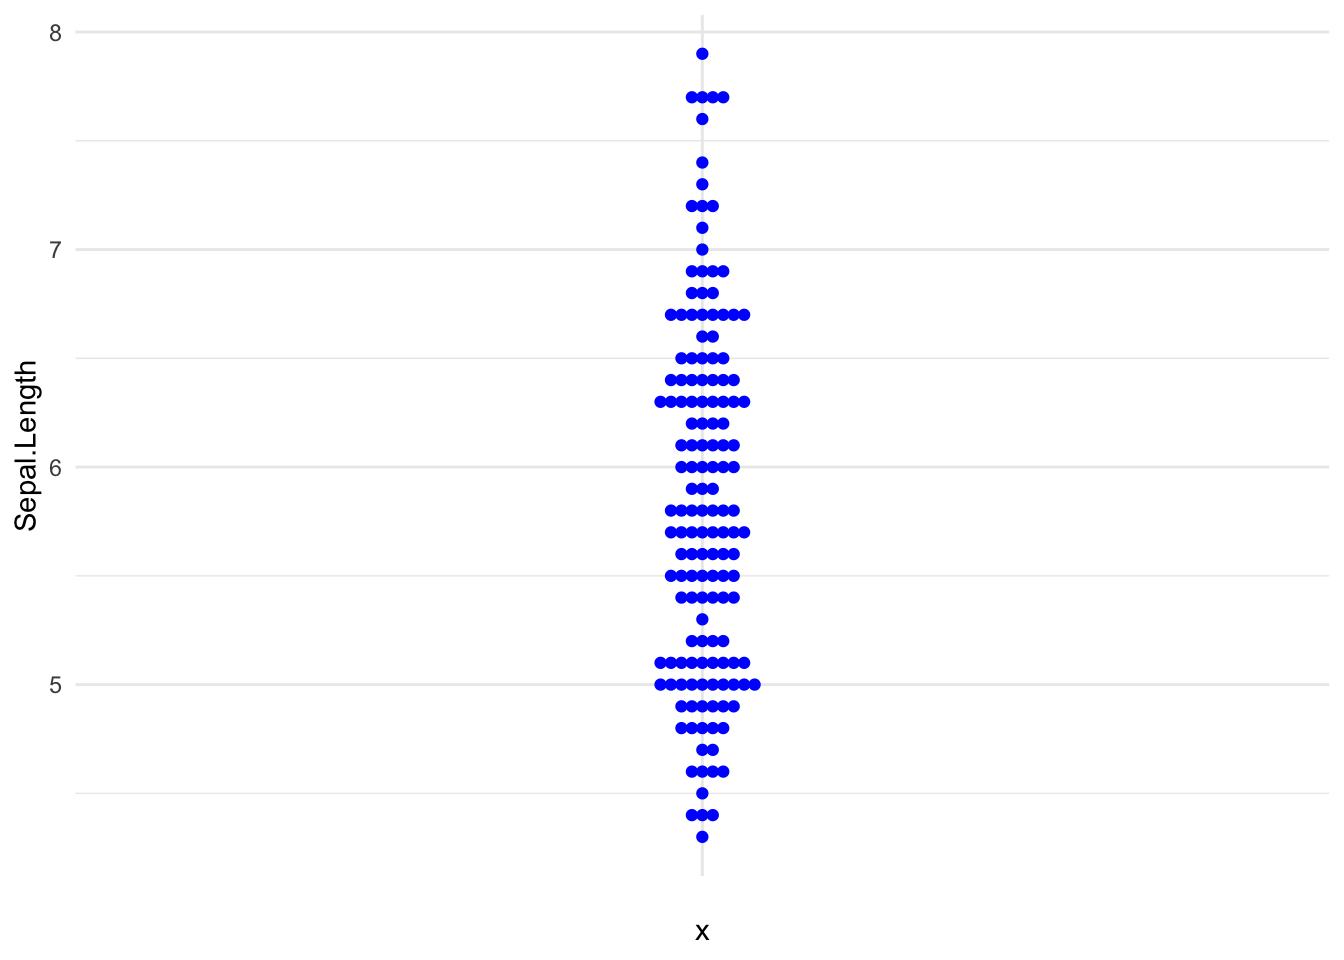
自定义颜色
Show/Hide Code
ggplot(iris,aes(y=Sepal.Length,x='')) +
  geom_beeswarm(color='blue') +
  theme_minimal()
还有更多可以通过“method”参数来控制的群峰图方法,例如"center"、"square"、"hexagon"等。 见ggbeeswarm包文档。
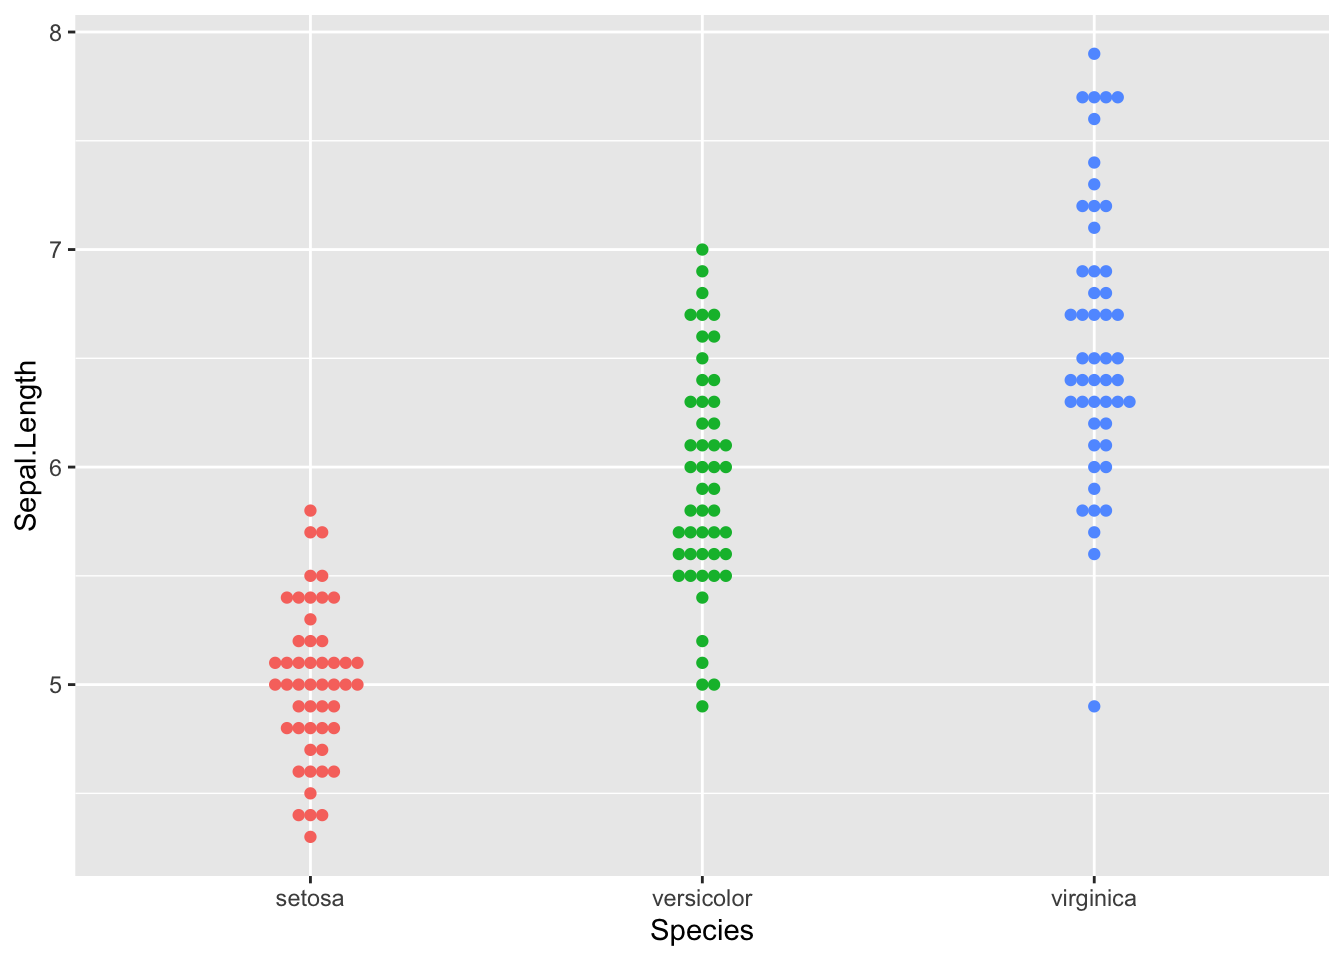
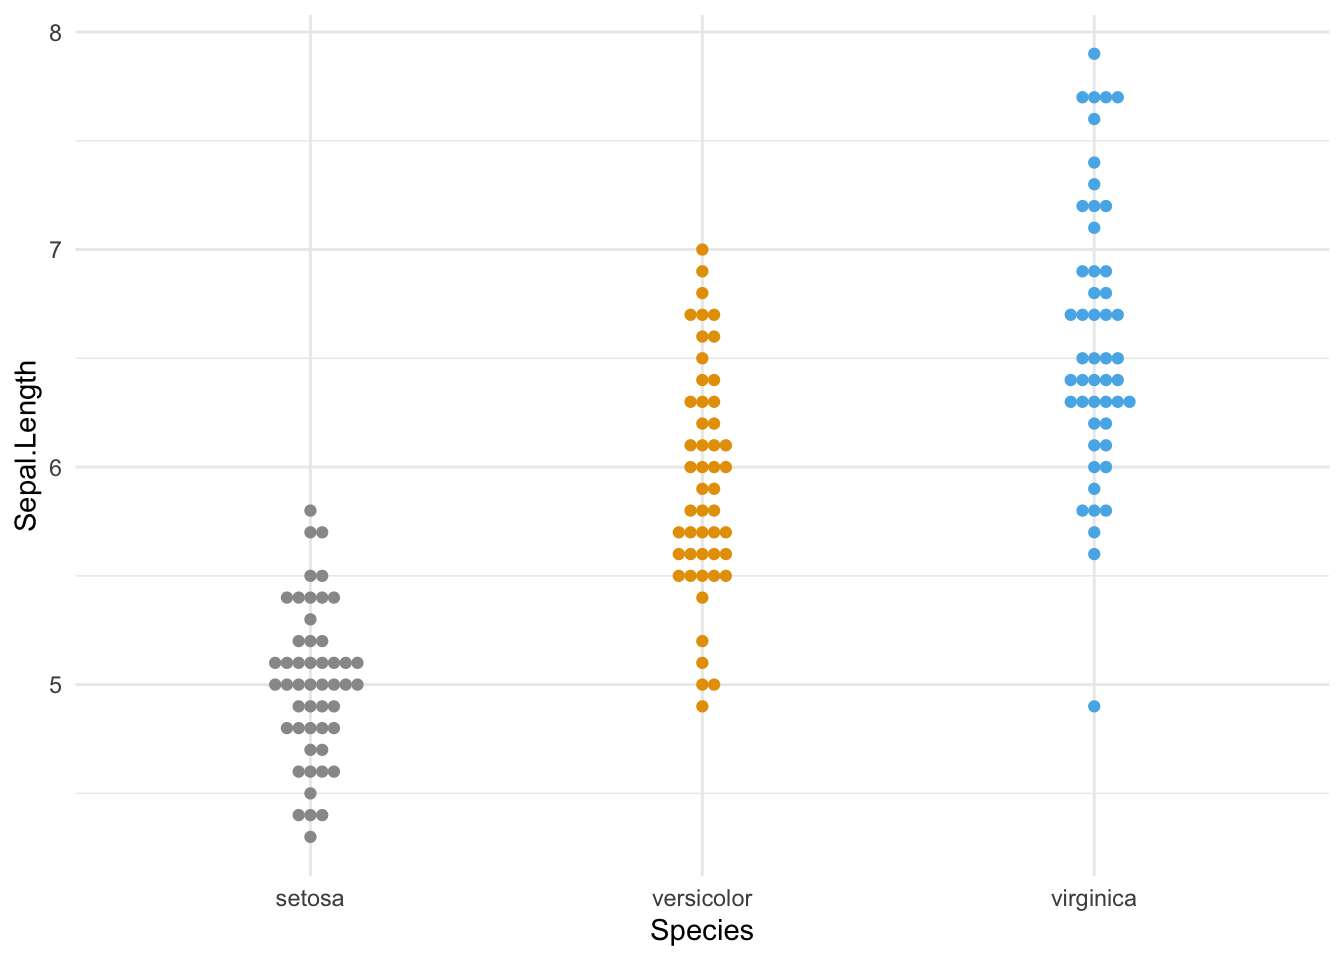
分组
Show/Hide Code
ggplot(iris,aes(x=Species, y=Sepal.Length, colour=Species)) +
  geom_beeswarm() +
  theme(legend.position = "none")
Show/Hide Code
ggplot(iris,aes(x=Species, y=Sepal.Length, colour=Species)) +
  geom_beeswarm() +
  scale_color_manual(values=c("#999999", "#E69F00", "#56B4E9")) +
  theme_minimal() +
  theme(legend.position = "none")